Monitor Clients
Applies To: Wi-Fi Cloud-managed Access Points (AP125, AP225W, AP325, AP327X, AP420)
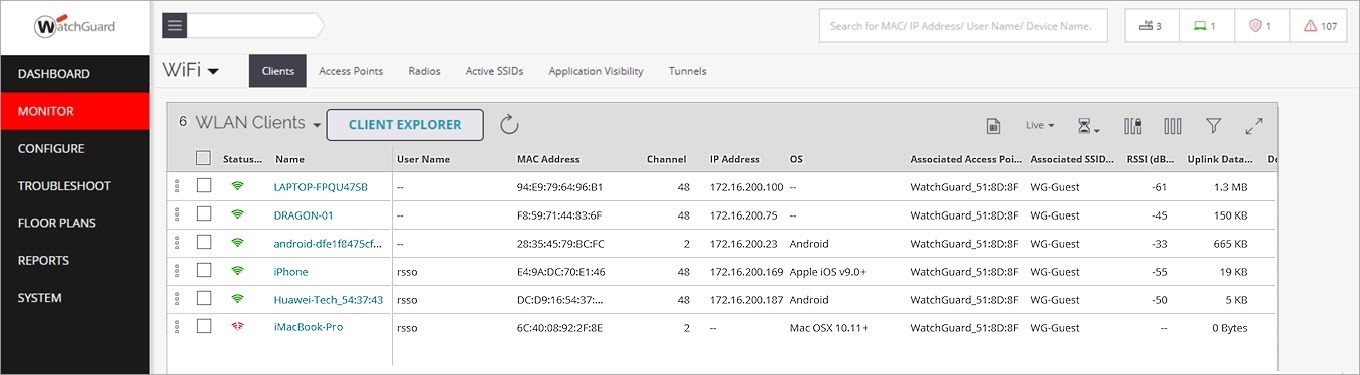
You can filter live clients or all clients, download a list of clients, view ongoing activities, freeze columns, add or remove columns, filter the display, and switch to full screen mode using the icons at the top-right of the page. For more information, see Table Actions for Monitor Pages.
Data in the columns represent live data updated every 15 minutes.
The two display options are:
Live Clients
- Clients that are successfully connected to APs
- Clients that failed to connect
All Clients
- Clients that are successfully connected to APs
- Clients that failed to connect
- Clients that are currently visible but not connected to an AP
- Clients that are currently not visible, but previously had connected to an AP
- Clients that are currently not visible and failed to connect on their last attempt
Client Properties
The client properties include this information:
| Property | Description |
|---|---|
| Status | Indicates if the client is successfully associated or failed to connect. |
|
Name |
Specifies the user-defined name of the client. |
|
User Name |
The username of the client. |
| MAC Address | Specifies the unique 48-bit IEEE format address of the client assigned to the network adapter by the manufacturer. |
|
IP Address |
IP address of the client. |
| IPv6 Address | IPv6 address of the client. |
|
OS |
Name of the operating system on the client. |
| Associated Access Point | Specifies the AP with which a client is associated. This is the AP through which the client communicates with other clients and devices on the network. |
|
Associated SSID |
Specifies the operating SSID of the AP with which the client is associated. |
| Frequency Band | Indicates the frequency band on which the client operates (2.4 GHz or 5 GHz) |
| Capability | Indicates the 802.11 protocol used by the client, such as 802.11ac Wave 2. |
| Channel | The channel in use by the client. |
| RSSI (dBm) | Displays the observed RSSI (Received Signal Strength Indicator) value for the client. |
| Best RSSI (dBm) | Displays the best RSSI (Received Signal Strength Indicator) value seen for the client. |
| Uplink Data | Indicates the amount of data transferred by the client. |
| Downlink Data | Indicates the amount of data received by the client. |
|
Avg. data rate |
The average amount of data transferred. |
|
Retry Rate (%) |
Indicates the retry rate as a percentage . |
|
Connected / Disconnected Since |
Date and time since the client was connected or disconnected from Wi-Fi Cloud. |
|
First Detected At |
Indicates the time and day when the client was first detected. |
|
Location |
Location of the client. |
| Sticky | Indicates whether the client is a sticky client. A sticky client is a client that remains connected to an AP even though there is an AP with better signal strength nearby. |
| Vendor Name | Vendor name of the client. |
|
Role |
After a client is connected to any SSID, the client is assigned with a role configured in the SSID profile. |
| Google Authorized | A boolean value to represent if the client is authorized using Google Integration. |
| Tag | Additional info about the client. |
Client Details
When you click on a client on the Clients page, several widgets provide information on client activity.
| Client Widgets | Description |
|---|---|
| Client Performance Issues | Any performance issues with the client are listed. This includes recommendations for how to fix the root cause of the issue. |
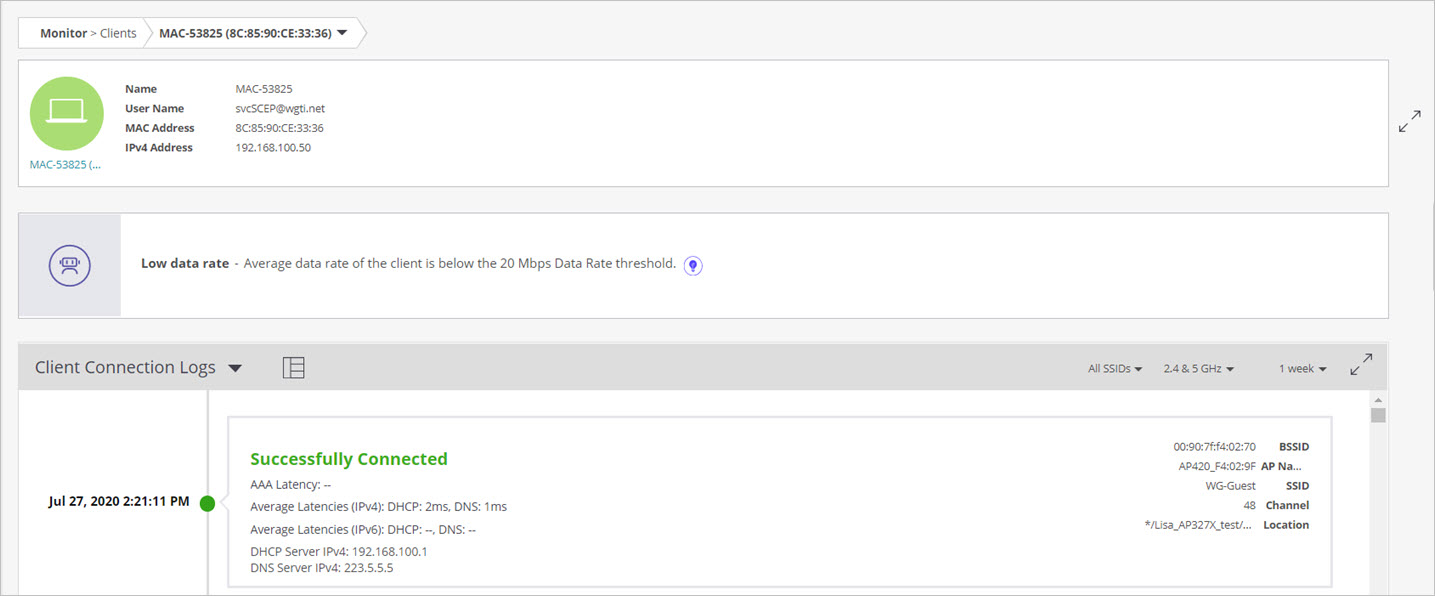
| Client Connection Logs |
The connection logs for the client indicating either successful (green) or failed (red) connection attempts made by the client. A red symbol in the Event column of the connection logs denotes a client connection failure. Hover over the red text to display information about the failure type (Association, Authentication, Network). |
| Client Event Logs |
Displays a list of client connectivity events:
|
| Client Baseline |
Calculates the baseline of the average data rate, RSSI, and retry rate for an individual client over a period of time. The anomalies are calculated by comparing the data rate against the globally configurable thresholds for low data rate, low RSSI, and high retry rate. |
|
A graph that represents data usage by applications. The graph represents data for the top five applications with highest traffic. Hover on the bar graph to view data usage details. |
|
|
A graph that represents the data sent and received by the client every 15 minutes. This data usage includes uplink and downlink data for all applications. |
|
|
Provides details of the applications used by the client. You can filter the data based on these applications:
Hover on the pie chart to view overall aggregated data. The data provides information about Total Sessions, Affected Sessions, Total Experience Time, and Poor App Experience. |
|
|
Displays a list of APs currently seeing the client. |
|
| Recently Probed SSIDs | Displays a list of SSIDs that the client has recently probed. |
| Association History | Displays a list of the APs to which the client has previously associated. |
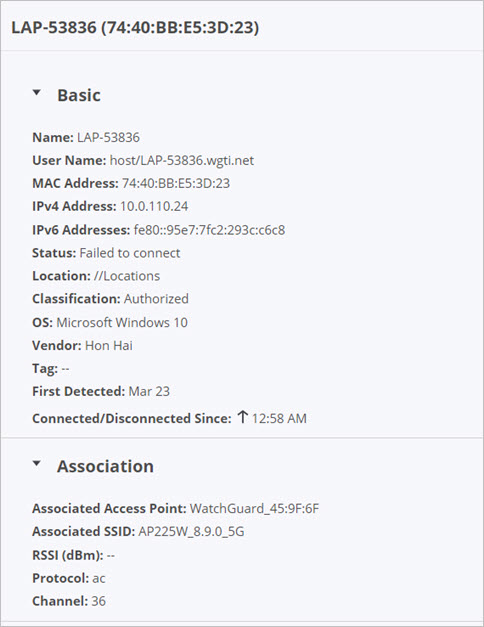
Client Properties
Click the client name to see the detailed client properties.
This information includes basic information such as the client's MAC address, IP address, location, OS, and classification details.
You can also view association details that includes the AP to which the client is associated, the SSID, RSSI, protocol, and channel in use.
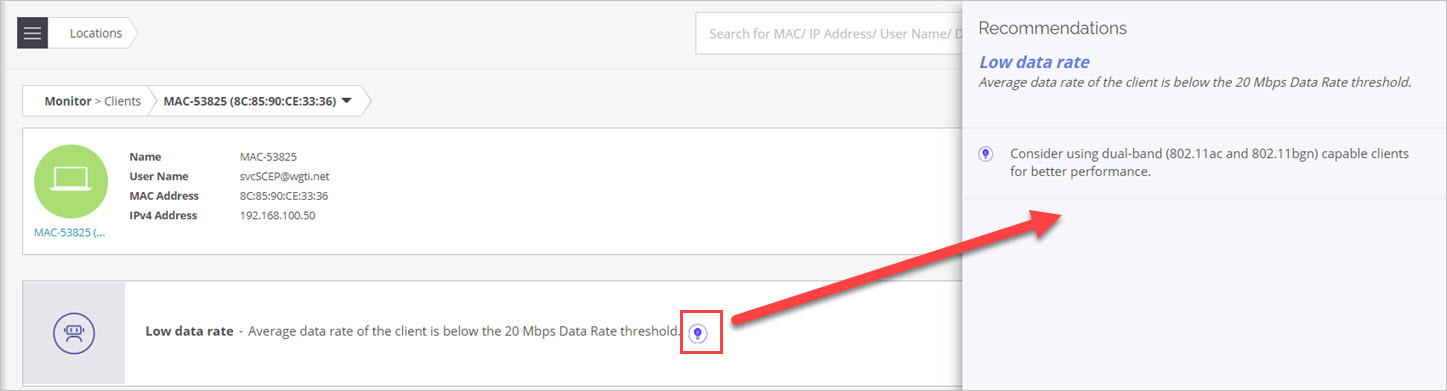
Client Performance Issues
Any performance issues with the client are listed. Click ![]() (How do I fix this?) to see the root cause analysis of the issue and any recommendations.
(How do I fix this?) to see the root cause analysis of the issue and any recommendations.
You can also view these issues from Performance Dashboard.
The performance analysis feature can diagnose these symptoms and offer recommendations on how to resolve these issues:
- Low RSSI
- Low data rate
- High retry rate
- High DHCP, AAA, and DNS server latency
These possible causes are analyzed to display the matching symptoms:
- Poor coverage
- Low RSSI (signal strength)
- Low signal-to-noise ratio (SNR)
- High interference
- Low data rate
- High retry rate
- High contention (BSSID/clients)
- Sticky clients
- Client that does support the latest 2.4 GHz or 5 GHz protocols
- Wireless band issues:
- Client does not support the 5 GHz band
- 5 GHz capable client is operating in 2.4 GHz band
- No 5 GHz SSIDs available for 5 GHz capable clients.
The performance analysis features finds the root cause of a failure based on the these parameters:
- Types of symptoms and the number of clients that are showing the symptoms at a location.
- Domain knowledge that determines the reason why an issue occurs, such as frequency band issues, too many clients with high uplink traffic, or poor coverage are potential reasons for an issue.
- System knowledge about configuration settings that might cause the issue, such as the transmit power and dynamic channel selection settings.
There is no recommendation available if the root cause is based on location, SSID, vendor name, operating system, or AP.
Client Actions
To perform actions on a client, right-click the client name, then select an action.
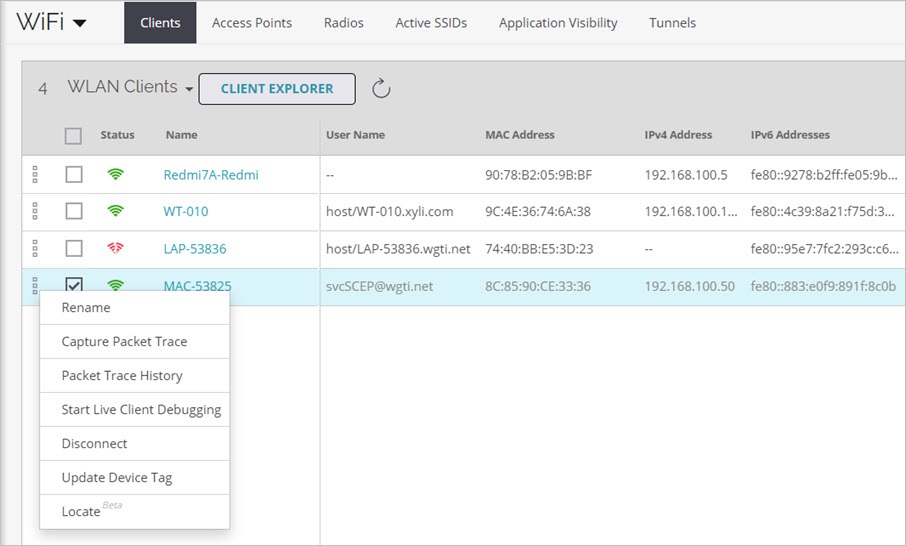
- Rename — Change the name of the client.
- Capture Packet Trace — Intercept data packets between APs and clients for analysis. For more information, see Capture Packet Trace.
- Packet Trace History — Display packet traces for the client captured in the last 30 minutes.
- Start Live Client Debugging — Display live logs for the client. For more information, see Live Client Debugging.
- Disconnect — Disconnects the client from the AP.
- Update Device Tag — Update additional information about the client.
- Locate — View the location of the client on the floor map. If there is no floor map available, the locate function shows the client's approximate distance from the nearest sensing AP. For more information, see Locate APs and Clients.
Client Explorer
The Client Explorer provides an overview of all clients at a location and enables you to view a graphical client distribution based on client properties.
To view the Clients Explorer:
- Select Monitor > WiFi > Clients.
- Click Client Explorer.
You can also view the Client Explorer in Monitor > WIPS > Clients.
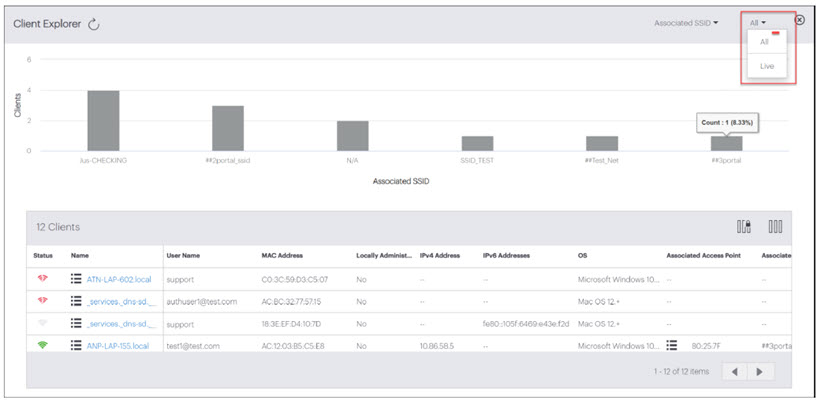
You can filter the devices based on the device status (All or Live).
Use the attribute drop-down menu to view graphical AP distribution based on:
- Associated SSID
- Vendor
- Capability
- Channel
- Protocol
- Associated AP Mac
- Group