Client Connection Logs
Applies To: Wi-Fi Cloud-managed Access Points (AP125, AP225W, AP325, AP327X, AP420)
There are two different views for the Client Connection Logs:
Timeline View
The Timeline View provides the list of connections logs with these details:
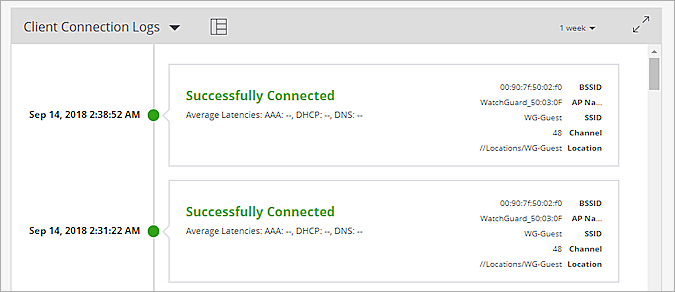
- Timestamp — Indicates the date and time when the client connected to an AP.
- Average Latencies — Displays the average latencies for the different stages of the Wi-Fi connection for the client.
- BSSID — BSSID is the MAC address of the AP to which the client attempted to connect.
- AP Name — Name of the AP to which the client attempted to connect.
- SSID — SSID of the WLAN to which the client is connected.
- Channel — Operating channel of the AP to which the client attempted to connect.
- Disconnect — Disconnects the client from the AP.
Grid View
The Grid View contains detailed information in a tabular format:
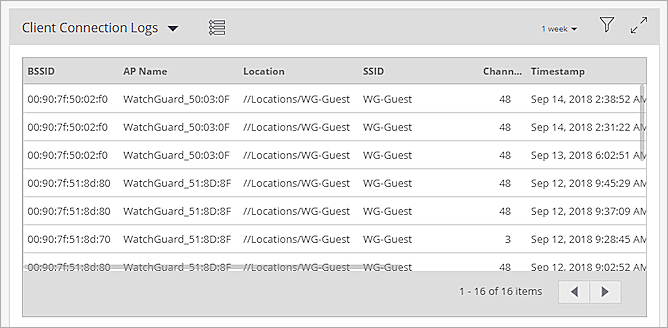
- BSSID — BSSID is the MAC address of the AP to which the client attempted to connect.
- AP Name — Name of the AP to which the client attempted to connect.
- SSID — SSID of the WLAN to which the client is connected.
- Channel — Operating channel of the AP to which the client attempted to connect.
- Timestamp — Indicates the date and time when the client connected to an AP.
- Event — Indicates if the client successfully connected.
Event Failures
A red symbol in the Event column of the connection logs denotes a client connection failure.
A Download Packet Trace link will appear if you have enabled Automatic Packet Capture. For more information, see Automatic Packet Capture for Client Failures.
Hover over the red text to display information about the failure type:
Association Failure
- AP association limit exceeded
- Capability mismatch
- Association failure
Authentication Failure
- EAPOL 4-way handshake failed
- RADIUS authentication failure
- RADIUS Server not reachable - Phase 2
- RADIUS server not responding
- Incorrect Pre-Shared Key
- Fast roaming failed
Network Failure
- Captive Portal authentication failed
- Captive Portal - shared secret mismatch
- Captive Portal - client in blackout period
- DHCP failed
- DNS failure
- WAN failure - Phase 2
Automatic Packet Capture for Client Failures
You can automatically capture a packet trace when client connectivity failures are detected. You can then analyze these packet traces in the Client Connection Logs in Discover to troubleshoot connectivity issues with your devices. For more information, see Capture Packet Trace.
A Download Packet Trace link will appear in the logs when a failure occurs. Five of the latest packet traces are stored for each client and these traces are retained for a maximum of seven days.
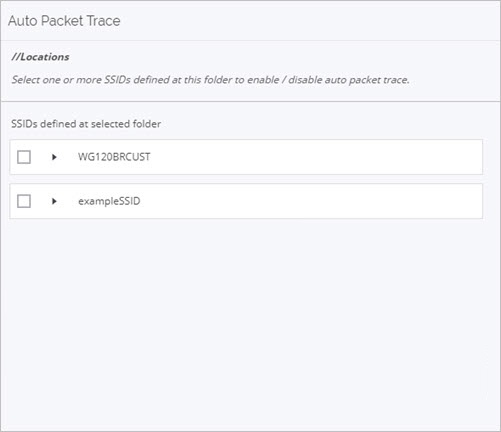
You can enable automatic packet capture in Discover:
- From Discover, select Configure > Troubleshoot > Packet Trace.
- Click Auto Packet Trace.
- Select the SSIDs that will perform an automatic packet trace after a client connectivity failure.