Navigate WatchGuard WebCenter
Applies To: Locally-managed Fireboxes
Because WatchGuard WebCenter is a dynamic, interactive, real-time web UI application, with a single click you can quickly move from page to page, see more refined data in your log messages and reports, and manage your certificates. The available navigation options are different for different pages in the web UI. After you have logged in, you can select options from the Log Manager, Report Manager, and CA Manager menus.
About the Log Manager Devices and Servers Pages
These two examples show the main Log Manager > Devices page that appears when you first log in to Log and Report Manager (if you have installed both the Log Server and the Report Server on the same computer) and the main Log Manager > Servers page. The navigation options for these two pages are the same.
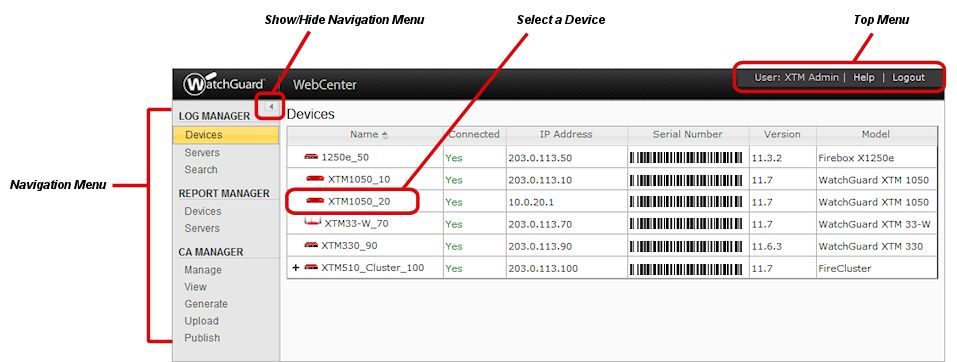
Navigation Menu
Select to see log messages or reports for your Fireboxes, WatchGuard servers, or certificates.
The navigation menu at the left of the WatchGuard WebCenter web UI is divided into three main sections: Log Manager, Report Manager, and CA Manager. The Log Manager and Report Manager sections each have two main menu items: Devices and Servers. The CA Manager section includes several menu items to help you manage your certificates.Select a menu item to see the information available in that category.
Log Manager > Devices
To see all the members of a FireCluster, click ![]() to expand the FireCluster.
to expand the FireCluster.
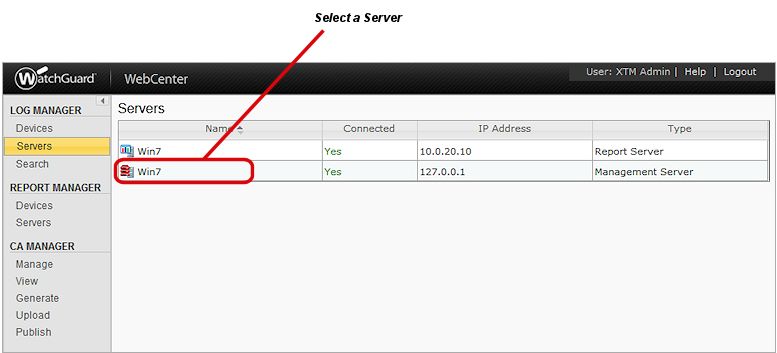
Log Manager > Servers
Select this menu item to see the list of all the WatchGuard servers that have sent log messages to your Log Server. The Servers list includes the name of the server, the connection status of the server, the IP address of the server, and the type of server (Management Server, Log Server, Report Server, Quarantine Server, or WebBlocker Server).
Log Manager > Search
Select this menu item to search the log messages for one device for specific information. You can specify a date or date range, and keywords in your search parameters.
Report Manager > Devices
Select this menu item to see the list of all the Fireboxes that have reports on your Report Server. The Devices list includes the name of the device, the serial number of the device, the IP address of the device, and the device model number or type.
To see all the members of a FireCluster, click ![]() to expand the FireCluster.
to expand the FireCluster.
To see all the devices included in a report group, click ![]() to expand the group.
to expand the group.
Report Manager > Servers
Select this menu item to see the list of all the WatchGuard servers that have reports on your Report Server. The Servers list includes the name of the server, the IP address of the server, and the type of server.
Show/Hide Navigation Menu
You can hide the left navigation menu to increase the size of the main display and see more information in the details of the log messages and reports.
- To increase the main display size, at the top of the left navigation menu, click
.
- To restore the left navigation menu, click
.
Select a Device or Select a Server
Click the Name of a device or server to go to the page for that device or server.
Top Menu
From the Top Menu, you can see the user name you logged in with, launch context-sensitive Help for the current page, and log out of WatchGuard WebCenter.
About the Log Messages Page for a Device
This example shows a device Log Messages page and explains the tools available on the Devices and Servers pages in the Log Manager section of the web UI.
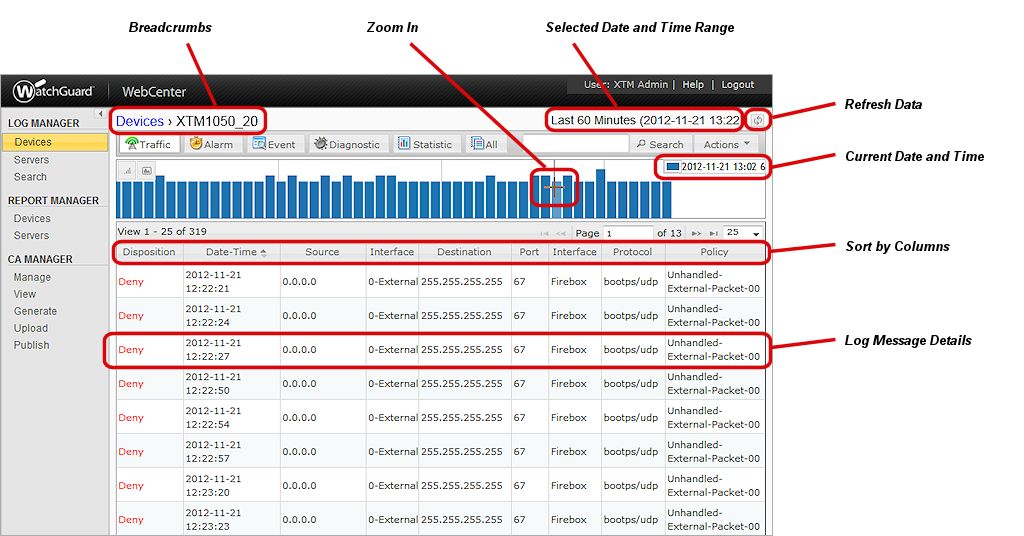
Breadcrumbs
Click a blue link in the Breadcrumbs path to go to another level in the path.
For example, in the path Devices > XTM_London > Application Usage, click XTM_London to return to the main Log Messages or Reports page for the XTM_London device, or click Devices to go to the main LOGS or REPORTS page with all the connected devices.
Zoom In
Use your cursor to select a section of a chart to zoom in on a smaller period of time included in the chart.
Selected Date and Time
The date and time range you selected from the Actions drop-down list appears for reference.
Refresh Data
Click ![]() to refresh the data for the predefined date and time range you selected.
to refresh the data for the predefined date and time range you selected.
Search
In the Search text box, type the text to search for in the log messages that appear on a Device or Server page. This option is not available for REPORTS pages. To refine your search, you can also specify the name of one column to search in. Though you can search for any column included in your log files, some of the columns that are most often searched are: policy, protocol, src_ip, src_port, dst_ip, dst_port, src_intf, dst_intf, app_name, and app_cat_name.
For example, to search for all log messages with a source IP address that starts with 192.168, type src_ip=192.168.
Actions
For devices and servers, from the Actions drop-down list you can specify the Date-Time Filter options (select a preconfigured time range or specify a custom time range). For devices, you can also select to view a Timeslice Analysis and export log messages to a CSV file.
Current Data Date and Time
The date and time of the log message data in the chart where the Zoom In cursor is located.
Sort By Columns
Click a column header to sort the Servers, Devices, and Log Messages lists by that column.
Log Message Detail
Click a device log message to see more information about the log message. A dialog box appears with additional information. You can highlight the content of a log message to copy and paste it in another program.
Page View
You can change the number of log messages that are included in each Devices or Servers list, and go to another page of the list. The page view controls appear at the top and bottom of the list of log messages on each Device or Server page.
To change how many items appear on a page, from the drop-down list at the top or bottom of each list, select the number of records to view on each page: 25, 50, 75, or 100.
The number of items in the list and the number of pages increases or decreases, based on your selection.
To go to another page in the list, click the arrows at the left or right of the Page text box.
Or, in the Page text box, type a page number and press Enter on your keyboard.
About the Reports Page for a Device
This example of a device Reports page explains the tools available on the Devices pages in the Report Manager section of WebCenter.
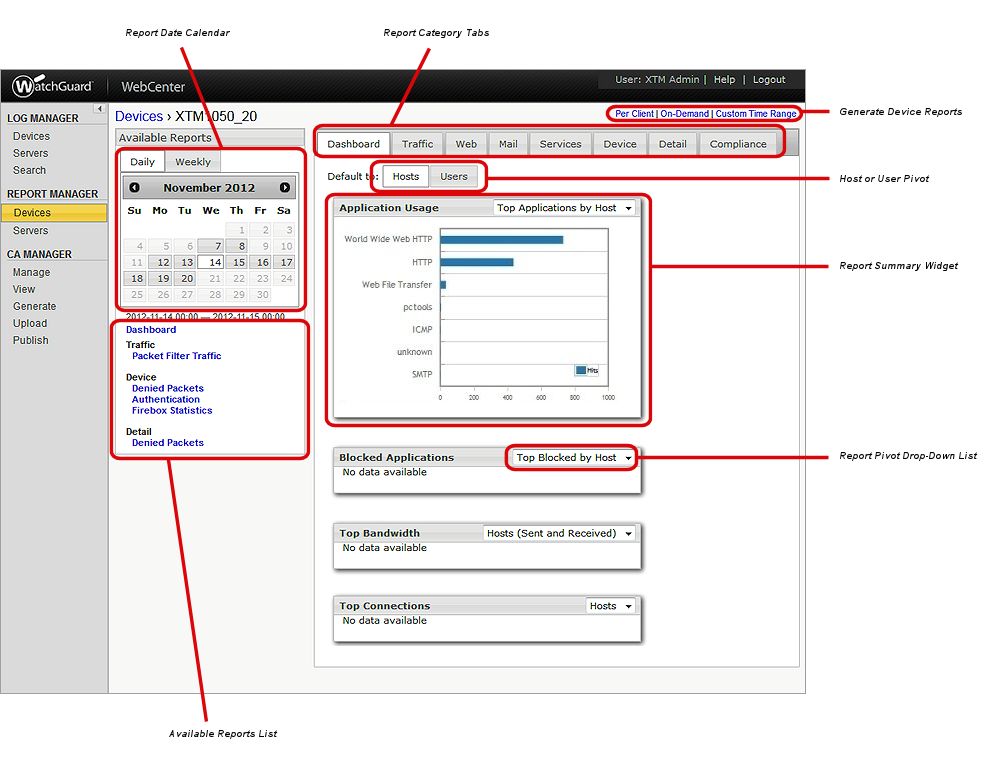
Report Date Calendar
Select the Daily or Weekly tab to see the daily or weekly Available Reports generated by your Report Server for the selected device. Select a date to see the reports available that day. If a date does not have a gray box around it, no reports were generated on that day,
Report Category Tabs
Select a report category tab to see the report summaries for the reports in that category.
Generate Device Reports
Select an option to generate a Per Client, On-Demand, or Custom Time Range report.
Report Summary Widget
This widget includes summary information of the data included in each report type in the selected category. If no information is available, there were not any log messages generated in that category for the date range you selected.
Report Pivot Drop-Down List
From both the report summary widgets and the complete Available Report pages, you can use the report pivot drop-down lists to see all the data for the reports that are available in the selected category.
Available Reports List
This list includes all the reports that were generated for your device for the date range you selected in the Report Date Calendar.
About the Reports Page for a Server
This example of a server Reports page explains the tools available on the Servers pages in the Report Manager section of WebCenter.
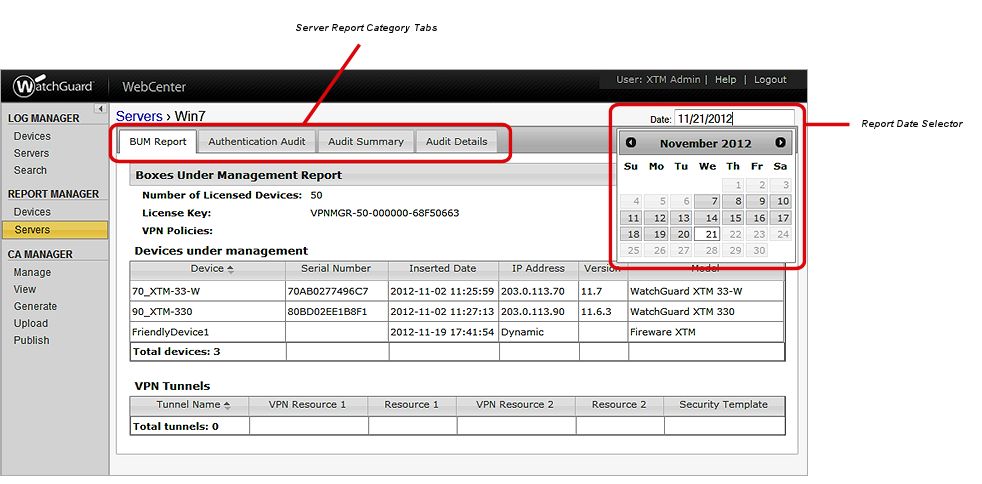
Server Report Category Tabs
Select a tab to see the reports available for the server.
Report Date Selector
Move your cursor to the Date text box. When the calendar appears, select the month and day for the reports you want to see.
About the Manage Certificates Page
From the CA Manager pages, you can review and change the status of the certificates for your Fireboxes. You can also generate new certificates or upload and publish existing certificates.
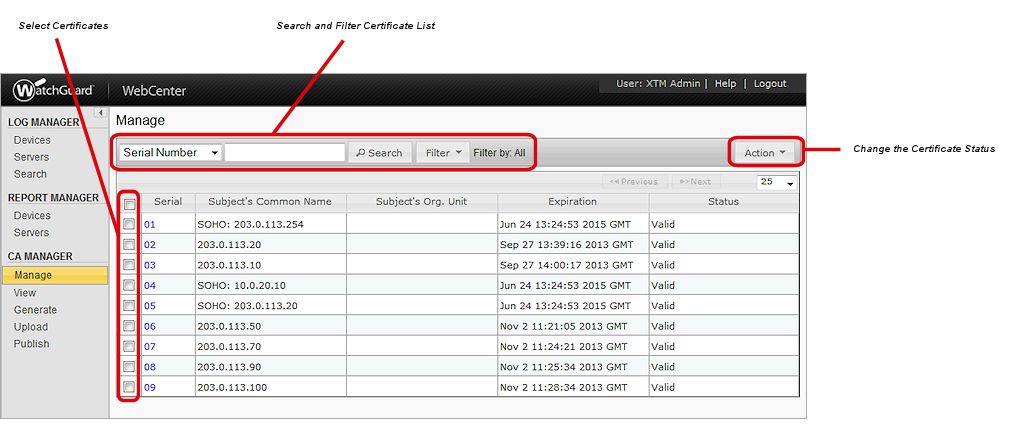
Select Certificates
Select the check box for one or more certificates to apply the same action to all the selected certificates.
Search and Filter Certificates List
You can use the search and filter options to refine which certificates that appear in the certificates list. You can search by serial number, common name, or organizational unit. You can filter the list by the current status of the certificates: valid, revoked, or expired.
Change the Certificate Status
When you select the check box for one or more certificates, you can change the status of all the selected certificates at one time. Select an option from the Action drop-down list: Revoke, Reinstate, or Destroy.
See Log Messages & Reports in WebCenter
View Device Log Messages in WebCenter
Search Device Log Messages in WebCenter
View Server Log Messages in WebCenter
Search Server Log Messages in WebCenter
View Reports in Report Manager
View Custom Time Range Reports