After you connect to WatchGuard WebCenter, you can review the log messages sent from your WatchGuard servers to your WatchGuard Log Server. When you first connect to WatchGuard WebCenter, the LOG MANAGER > Devices page appears.
To see the list of WatchGuard servers that send log messages to this WatchGuard Log Server, select LOG MANAGER > Servers.
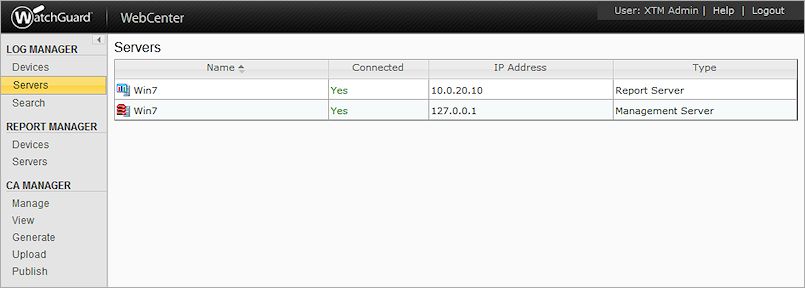
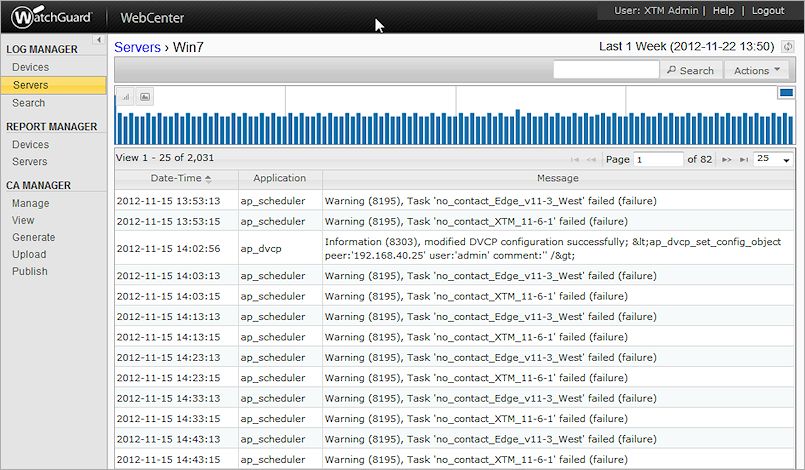
On the Servers page, all of the WatchGuard servers that send log messages to your Log Server appear. From the Servers page, you can select any server to view the log messages for that server, even if the Connected status is No. When you select a server from the Servers list, the log messages page appears with a log frequency graph at the top of the log messages list that shows the range of log message data for your server. The default setting for the log frequency graph is a bar chart, but you can also select to view the data in a line chart. You can select to view log messages for a predefined time range, or you can specify a custom time range. You can also sort the list of log messages by date-time, application, or message details.
To see the log messages for a server:
- In the Servers list, select the Name of a server.
The log messages page for the selected server appears.
- To select a different time range, from the Actions drop-down list, select a preconfigured time range, or specify a custom time range.
A list of available log messages for the time range you specified appears. - If you have selected a predefined time range, click
 to refresh the data in the log message list. This retrieves new data for the specified time range from the moment you refreshed the data. does not appear if you have specified a custom time range.
The log message data is updated for the specified time range.
For example, at 12:40 PM you select a 30 Minute time range and all of the available log messages from 12:10–12:40 PM appear for your selected server. After you review the log message data, at 12:50 PM you want to see updated log messages for the last 30 minutes. Click and the log message list updates to include log messages from 12:20-12:50 PM. - To see a line chart of the log message data, click
 .
.
To see a bar chart of the log message data, click .
.
This is the default setting. - To copy the content of a log message, highlight the message text, right-click the highlighted text and select Copy, or press Ctrl+C on your keyboard.
- To zoom in on a section of the log frequency graph and see a smaller data set, place your mouse cursor over the graph, hold down your left mouse button, and drag the cursor to select a time range.
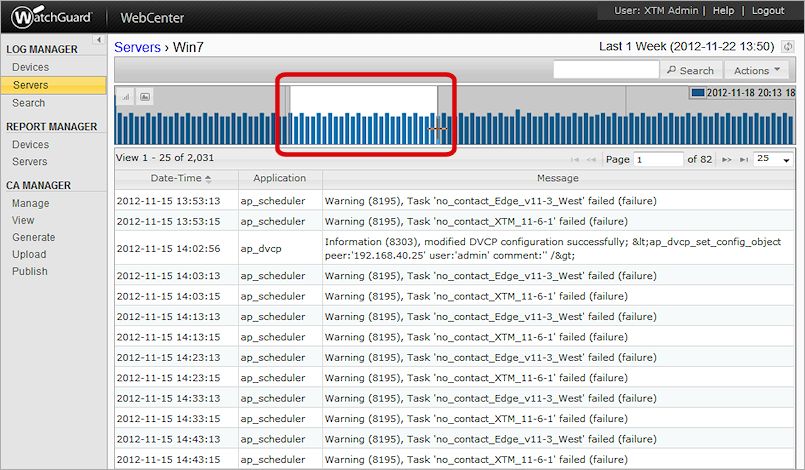
The log message list is updated based on your new selection and ![]() appears on the log frequency graph.
appears on the log frequency graph.
- To zoom out to the original time range, click
 .
.
Search Server Log Messages
You can use the Search feature to refine the log messages that appear for any of your servers. For more information about how to run a search for your servers, go to Search Server Log Messages in WebCenter.
See Log Messages & Reports in WebCenter
Connect to WatchGuard WebCenter