For both your Fireboxes and your WatchGuard servers, you can view the Available Reports that you schedule your Report Server to generate. For your Fireboxes, you can also generate Per Client, On-Demand, and Custom Time Range reports. Different reports are available for devices and servers. For any report that includes an IP address, host name, or user name, you can click it to see a more detailed report on the item you selected. Reports appear in the local time zone of the user who views or generates the reports.
See an Available Report for a Device
For device reports, you can see the Daily and Weekly Available Reports, you can generate Per Client and On-Demand reports, or you can specify a custom time range for a report. After you have opened a report, you can use the report pivot drop-down lists to refine your view of the report data, and use the links in each report to go to other, more detailed reports.
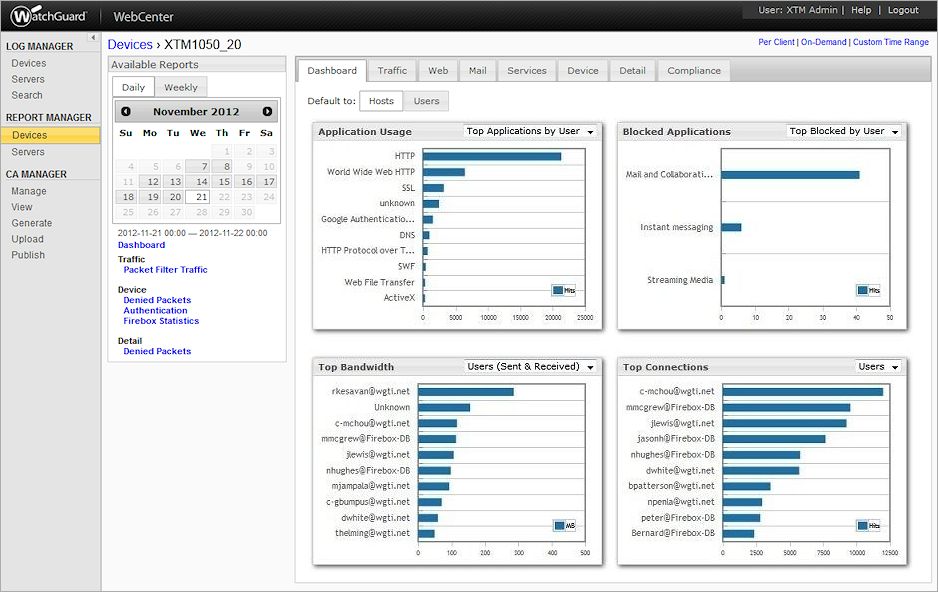
At the top of the report page for a device is a tab for each main category of reports. Available Reports categories for device reports include:
- Dashboard — Application Usage, Blocked Applications, Top Bandwidth, Top Connections
- Traffic — Packet Filter Traffic, Proxy Traffic, External Interface Bandwidth, VPN Bandwidth
- Web — Most Active Clients, Most Popular Domains, Web Audit, Web Activity Trend
- Mail — SMTP, POP3
- Services — GAV, IPS, WebBlocker, RED
- Device — Denied Packets, Alarms, User Authentication, Audit Trail, DHCP Lease Activity
- Detail — Alarms, Denied Packet (Client), POP3, SMTP, Web Audit, WebBlocker, URL Details
- Compliance — Alarm Summary, Audit Trail, Denied User Authentication Report, Gateway AntiVirus Summary, Intrusion Prevention Summary
At the left of the Device page is the list of Available Reports that have been generated as Daily and Weekly reports for the day that is selected in the interactive reports calendar. To see the reports available on another day, select another day from the calendar, and the Available Reports list updates to include the reports for that day. The dates when reports were generated appear highlighted in gray on the calendar. If a date does not have a gray box around it, no reports were generated on that day,
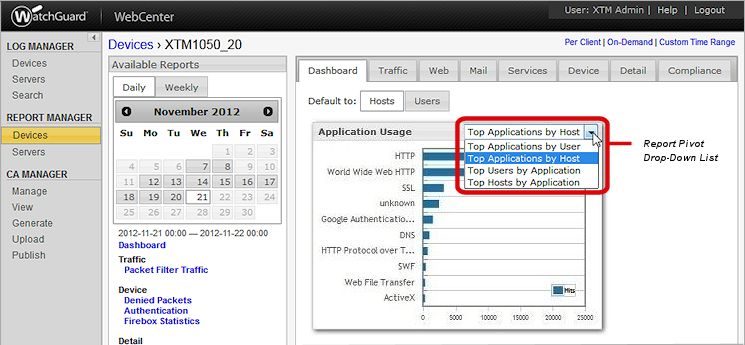
For both the report summary widgets and the complete Available Report pages, you can use the pivot drop-down lists to see all the data that is available for each report type in the selected category. Pivots enable you to see the report data for any report in many different report type configurations. For example, in the Application Usage report, the default report data view is Top Applications by User. From the pivot drop-down list on the Application Usage report, you can also select Top Applications by Host, Top Users by Applications, or Top Hosts by Applications. Each option you select from the pivot drop-down list enables you to see the report data in another way. You can also select whether to view report data on the Dashboard by hosts or by users.
The user unknown appears in your reports when there is traffic from a source that has not authenticated to your Firebox, such as traffic from applications that monitor your network. If your reports include the unknown user, it can be helpful to select to pivot your report on Hosts data instead of on Users data.
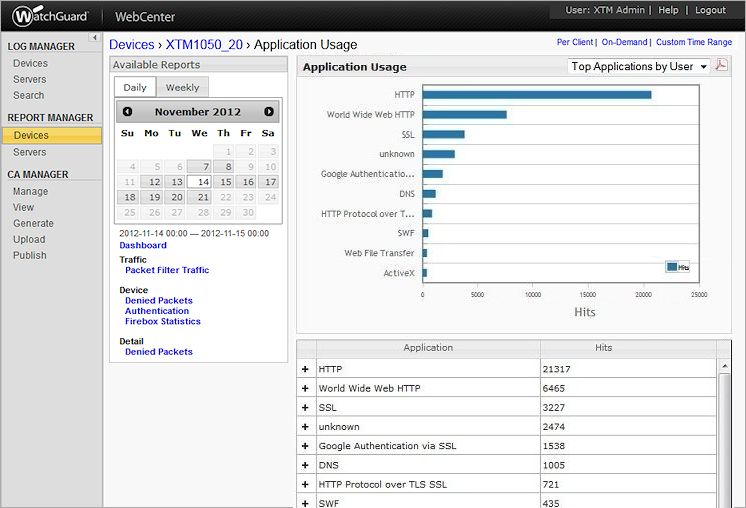
On the Dashboard page, pivot reports show data by Hits and by MB (megabytes). Each hit included in a report indicates one connection. For example, if an Application Usage report shows 20,000 Hits in the HTTP category, this indicates that the selected Firebox received 20,000 HTTP requests for web traffic for the dates you included in the report. Bandwidth reports include connections by bytes, indicated on the Dashboard page pivot reports in MB. Bytes that are received indicate information downloaded by an internal client. Bytes sent indicate information uploaded by an internal client.
To see an available report:
- From the Report Manager menu, select Devices.
The Devices page appears. - In the Devices list, select a device.
The Available Reports page appears for the device you selected, with the Dashboard tab selected.
- From the Available Reports section, select the tab for the type of report to review: Daily or Weekly.
The days on the calendar with available reports are highlighted. - From the calendar, select a reporting date.
The report summary widgets and report links update to show the report information from that day. - At the top of the Dashboard tab, click Hosts or Users to specify the how the data in your log messages appears in the pivot report.
This setting is saved for the next report your select. - To see summary data for another report in any category on that tab, from the report pivot drop-down list for a report, select another report type.
The updated report summary information appears in the report summary widget.
- To see summary report data for another category, select the tab for that category:
- Dashboard
- Traffic
- Web
- Services
- Device
- Detail
- Compliance
- To see a full report, from the Available Reports list, select a blue report link.
The selected report appears.
- To see the report data for the selected report category in another way, from the report pivot drop-down list, select another report option.
The report summary chart and report detail list are updated. - To see more detailed information about an item in the report details list, click + to expand the item.
For reports that include client information, you can also click the client detail link to open a Per Client Report for that client.
For more information about Per Client Reports, go to Generate Per Client Reports. - To return to the main reports page for any device, in the breadcrumbs, click the device name.
See a Server Report
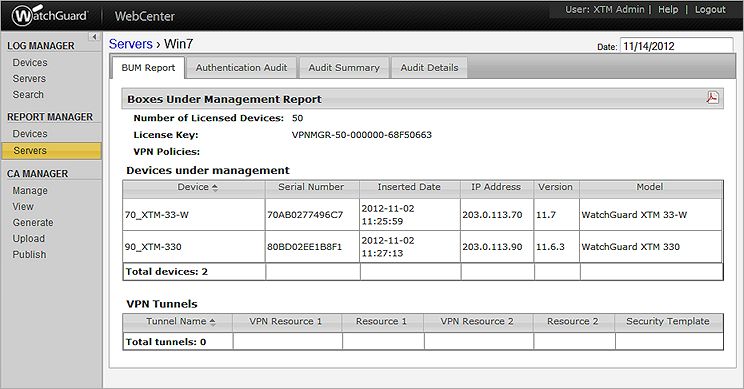
The categories for server reports include the BUM Report, Authentication Audit, Audit Summary, and Audit Details. The BUM (Boxes Under Management) Report is only available for the Management Server. In addition to information about your managed devices, the BUM Report includes data for all the VPN tunnels managed by your Management Server.
To see a server report:
- From the REPORTS section of the left navigation menu, select Servers.
The Servers page appears. - In the Servers list, select a server.
The Server Reports page appears for the server you selected. If you selected the Management Server, the BUM Report tab is selected.
- Select a tab to see the reports for that category:
- BUM Report
- Authentication Audit
- Audit Summary
- Audit Details
- To select a different date for the report data, place your cursor in the Date text box.
The date selection calendar appears.
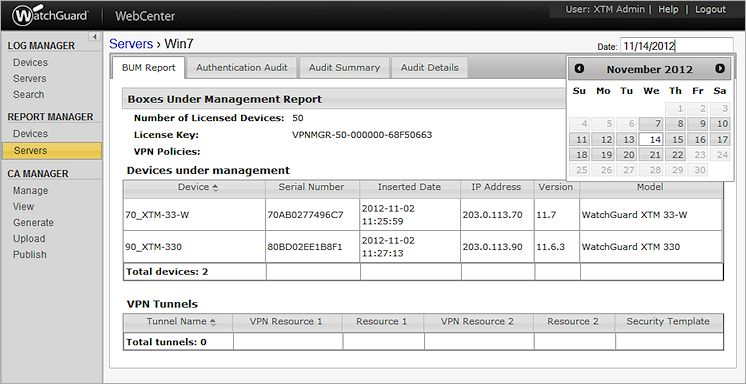
- Select a new date from the calendar.
The data in the report is updated.
Connect to WatchGuard WebCenter
See Log Messages & Reports in WebCenter