Applies To: Cloud-managed Fireboxes, Locally-managed Fireboxes
Information on the Traffic Monitor page can help you troubleshoot network performance.
This page is only available when your cloud-managed Firebox, or locally-managed Firebox with cloud reporting, is connected to WatchGuard Cloud.
To monitor traffic on cloud-managed Fireboxes and locally-managed Fireboxes with cloud reporting:
- Select Monitor > Devices.
- Select a Firebox.
The Device Summary page for the selected Firebox opens. - Select Live Status > Traffic Monitor.
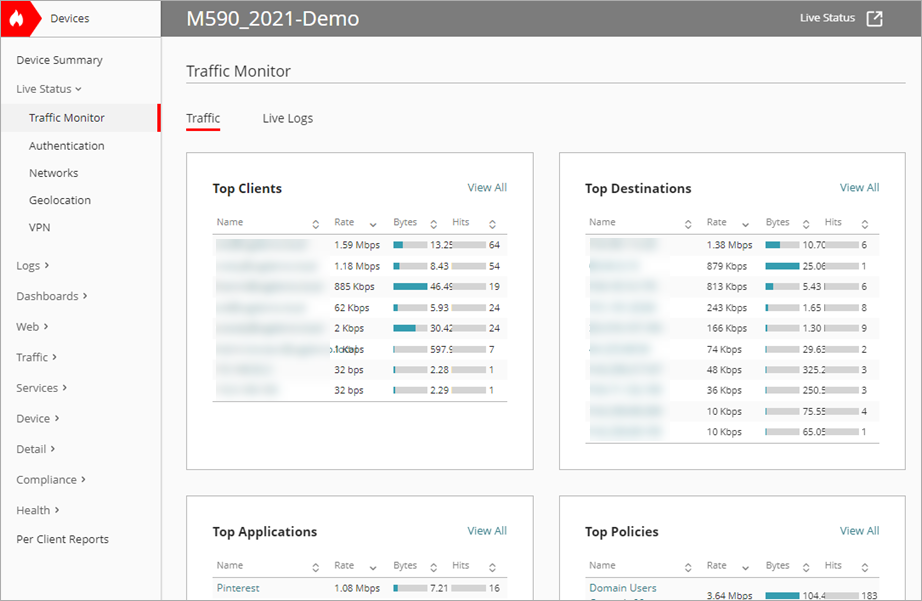
The Traffic Monitor page opens.
To open live status in a new window, click  in the upper, right corner of the WatchGuard Cloud window.
Real-time Traffic
On the Traffic tab, you can view real-time data on the currently active connections through your Firebox. Each tile on the Traffic tab shows the connection rate, number of bytes transferred through the connection, and the number of hits. The tiles refresh every 30 seconds.
Top Clients
Shows a list of the top 10 clients connected to the Firebox that use the most bandwidth.
Click View All to show all the clients connected to the Firebox.
Top Destinations
Shows a list of the top 10 most frequently visited destinations for current connections.
Click View All to show all the destinations visited.
Top Applications
Shows a list of the top 10 applications used.
Click View All to show all the applications.
Top Policies
Shows a list of the top 10 policies that currently manage the most traffic.
Click View All to show all the policies.
Top Destination Ports
Shows a list of the top 10 most frequently used ports for current connections to the Firebox.
Click View All to show all the ports used.
Top Countries
Shows a list of the top 10 most frequent countries identified by Geolocation for connections through the Firebox.
Click View All to show all the countries.
For all tiles, the Rate column displays the current rate of passing data. The Bytes column indicates the total byte count for all existing connections for that host. This is cumulative for all existing open connections.
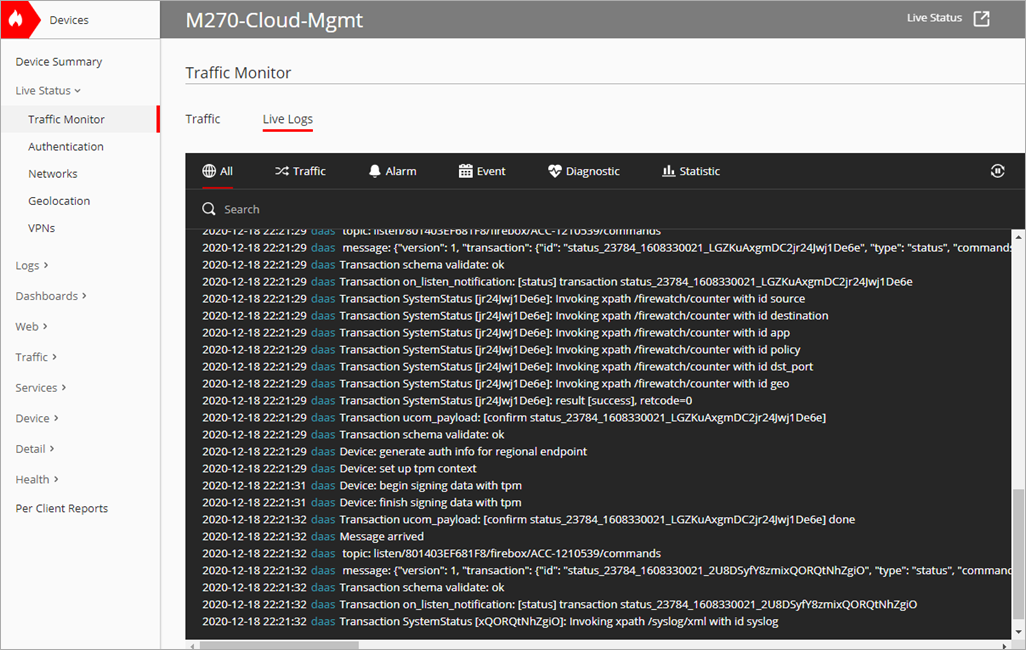
Real-time Log Messages
You can use the Live Logs tab to see log messages generated by your Firebox as they occur. The Firebox sends log messages as traffic passes through the device. On some networks, there can be a short delay as log messages are sent.
To view real-time log messages for a Firebox:
- Select Monitor > Devices.
- Select the Firebox.
- Select Live Status > Traffic Monitor.
The Traffic Monitor page opens. - On the Live Logs tab, view the log messages for traffic through the Firebox.
- In the right corner of the tab, click
 to stop and start the live feed of messages.
 - For Fireboxes and FireClusters, click
 to open a live feed of the messages in a separate window.
 - To search for a specific log message, in the Search text box, type the message you want to search for and press Enter.
- To maximize the viewing area in the window, click
 .
.
Filter Log Messages by Type
To filter log messages, on the Live Logs tab, click the filter or filters for the type of log messages you want to see.
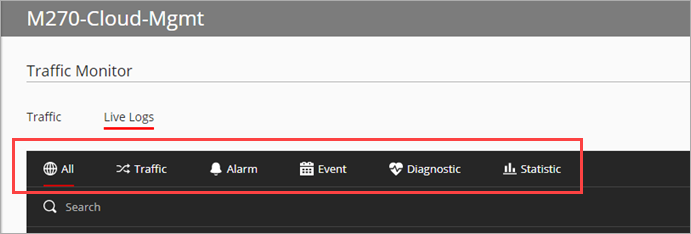
All
Shows all log messages.
Traffic
Shows traffic log messages the Firebox sends as it applies packet filter and proxy rules to traffic that goes through the device.
Alarm
Shows alarm log messages that are sent when an event occurs that triggers the Firebox to run a command.
Event
Shows event log messages the Firebox sends because of user activity.
Diagnostic
Shows diagnostic log messages with information that you can use to help troubleshoot problems.
Statistic
Shows statistic log messages with information about the performance of the Firebox. By default, the device sends log messages about external interface performance and VPN bandwidth statistics to your log file. You can use these logs to change your device settings as necessary to improve performance.
Add a Cloud-Managed Firebox to WatchGuard Cloud
Configure Traffic Types in a Firewall Policy
Add a Locally-Managed Firebox to WatchGuard Cloud