Applies To: Locally-managed Fireboxes
The Diagnostics page includes these tabs:
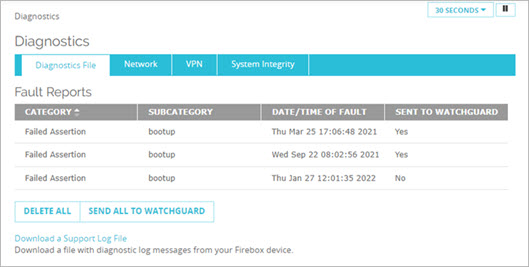
Diagnostics File
From the Diagnostics File tab, you can download a diagnostic log file (support.tgz) that includes packet trace information about your Firebox. For more information about how to download a diagnostic file, go to Download a Diagnostic Log Message File in Fireware Web UI.
If fault events have occurred on your Firebox, you can see and manage the Fault Reports. For more information about Fault Reports, go to Manage Fault Reports.
Network
You can use the Network tab to find diagnostic information for your Firebox. You can ping the source or destination IP address, trace the route to the source or destination IP address, look up DNS information for an IP address, or see information about the packets transmitted across your network (TCP dump). You can also include arguments in your task details to narrow the results.
For information about how to run diagnostic tasks, go to Run Diagnostic Tasks on Your Firebox.
VPN
From the VPN tab, you can run a VPN Diagnostic Report to see configuration and status information for a VPN gateway and the associated Branch Office VPN tunnels.
For information about how to run a VPN Diagnostic Report, go to Run the VPN Diagnostic Report.
System Integrity
To verify the integrity of files and directories on your Firebox, you can run an on-demand integrity check from the System Integrity tab.
For more information, go to System Integrity Checks.
Firebox TCP Dump Diagnostics video tutorial (7 minutes)