Applies To: Locally-managed Fireboxes
There are two types of statistical reports you can run to get statistical information about the VPNs on your Firebox:
ISAKMP Packet Trace
Includes statistical information to help you troubleshoot your VPNs.
VPN Diagnostic Report
Includes configuration and status information for a branch office VPN gateway and the associated branch office VPN tunnels, as well as information about issues with your VPN configuration and suggestions to resolve the issues.
View VPN Statistics
You can also see additional statistical information that you can use to help you troubleshoot your VPNs with a WatchGuard Technical Support representative. Statistical information is refreshed every 30 seconds, or at the Refresh Interval you select from the drop-down list at the top-right of the page.
To see statistical VPN information:
- Select System Status > VPN Statistics.
The VPN Statistics page opens with the Branch Office VPN tab selected. - Select the Debug tab.
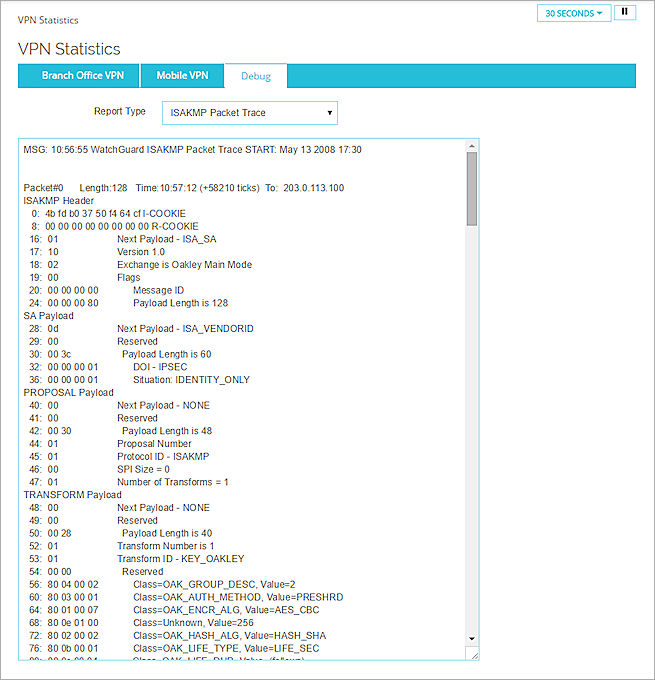
- From the Report Type drop-down list, select ISAKMP Packet Trace.
The packet trace details appear.
Run the VPN Diagnostic Report
To see configuration and status information for a branch office VPN gateway and the associated branch office VPN tunnels, you can run the VPN Diagnostic Report. When you run the report, the Firebox temporarily increases the log level for the selected gateway.
You can run the VPN Diagnostic Report from the Branch Office VPN tab or from the Debug tab.
To run the VPN Diagnostic Report for a gateway, from the Debug tab:
- Select System Status > VPN Statistics.
The VPN Statistics page appears with the Branch Office VPN tab selected. - Select the Debug tab.
- From the Report Type drop-down list, select VPN Diagnostic Report.
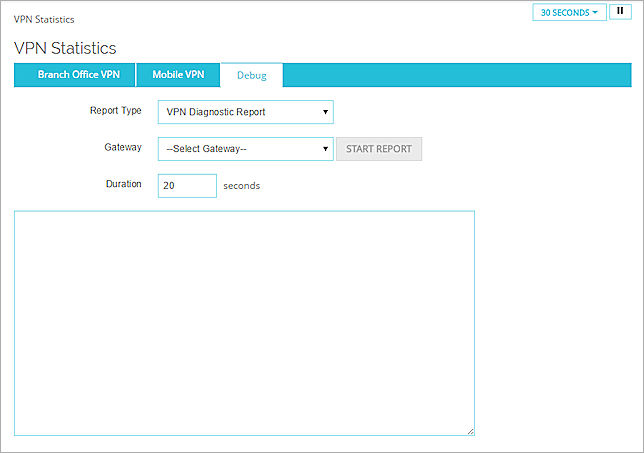
- From the Gateway drop-down list, select a gateway.
- In the Duration text box, type the amount of time to run the report.
The default interval is 20 seconds. - Click Start Report.
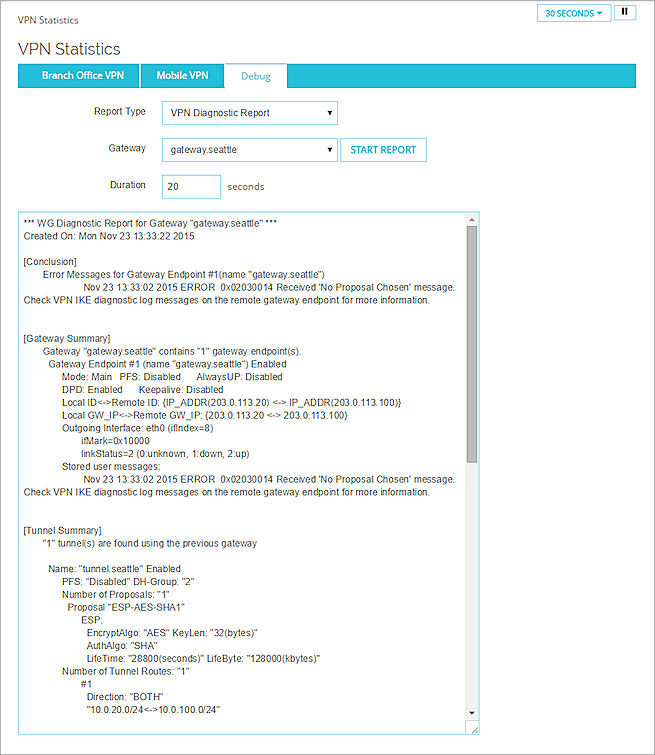
The report is generated for the selected gateway.
To run the VPN Diagnostic Report for a gateway, from the Branch Office VPN tab:
- Select the Branch Office VPN tab.
The traffic statistics for Branch Office VPN tunnels appear. - From the drop-down list select an option:
- Show All
- Virtual Interfaces
- Gateways
The available details for the selected option appear.
- Adjacent to the tunnel, click Debug.
The Debug tab appears with the correct Report Type and Gateway options for the selected gateway. The report is automatically generated.
You can also run the VPN Diagnostic Report from the System Status > Diagnostics page. For more information, go to Run the VPN Diagnostic Report.
VPN Diagnostic Report Details
The BOVPN Diagnostic Report includes these sections:
Conclusion
This is the complete report summary and can include information about actions you can take to resolve any issues identified by the report. For each tunnel route, the report shows whether the tunnel route was established, whether traffic was detected after the report started, and error messages related to the tunnel. Some error messages include information about what you can do to correct a problem with the BOVPN tunnel.
Gateway Summary
This is a summary of the gateway configuration and each configured gateway endpoint.
Tunnel Summary
This is a summary of the tunnel configuration for all tunnels that use the selected gateway. This includes both active and inactive tunnels.
Run-time Info (bvpn routes)
This section appears only when you run the diagnostic report for a branch office VPN virtual interface. It includes the static and dynamic routes that use the BOVPN virtual interface and the distance for each route. In Fireware v12.9 or higher, the Distance setting replaces the Metric setting.
Run-time Info (gateway IKE_SA)
The status of the IKE (Phase 1) security association for the gateway.
Run-time Info (tunnel IPSEC_SA)
The status of the IPSec tunnel (Phase 2) security association for active tunnels that use the gateway.
Run-time Info (tunnel IPSec_SP)
The status of the IPSec tunnel (Phase 2) security policy for active tunnels that use the gateway.
Address Pairs in Firewalld
The status of the address pairs for each tunnel. This section does not appear when you run the report for a branch office VPN virtual interface or for a BOVPN on a cloud-managed Firebox.
Policy checker result
The policies that manage inbound and outbound traffic for each tunnel route.
Related Logs
If tunnel negotiation occurs while the Diagnostic Report runs, the tunnel negotiation log messages appear in this section. If the remote device attempts to negotiate or rekey the tunnel while the report runs, the log messages that appear in this section include more informative details.