Applies To: WatchGuard Advanced Reporting Tool and Data Control
Alerts are tasks that continually monitor active queries to look for and report on specific events or conditions. When the conditions of the alert are met, an alert notification is triggered.
You can create up to 10 custom alerts. When you create a custom alert, you configure the frequency of the alert, the conditions to generate an alert, and the delivery method.
To review the current alerts and alerts history, from the left pane, select Alerts.
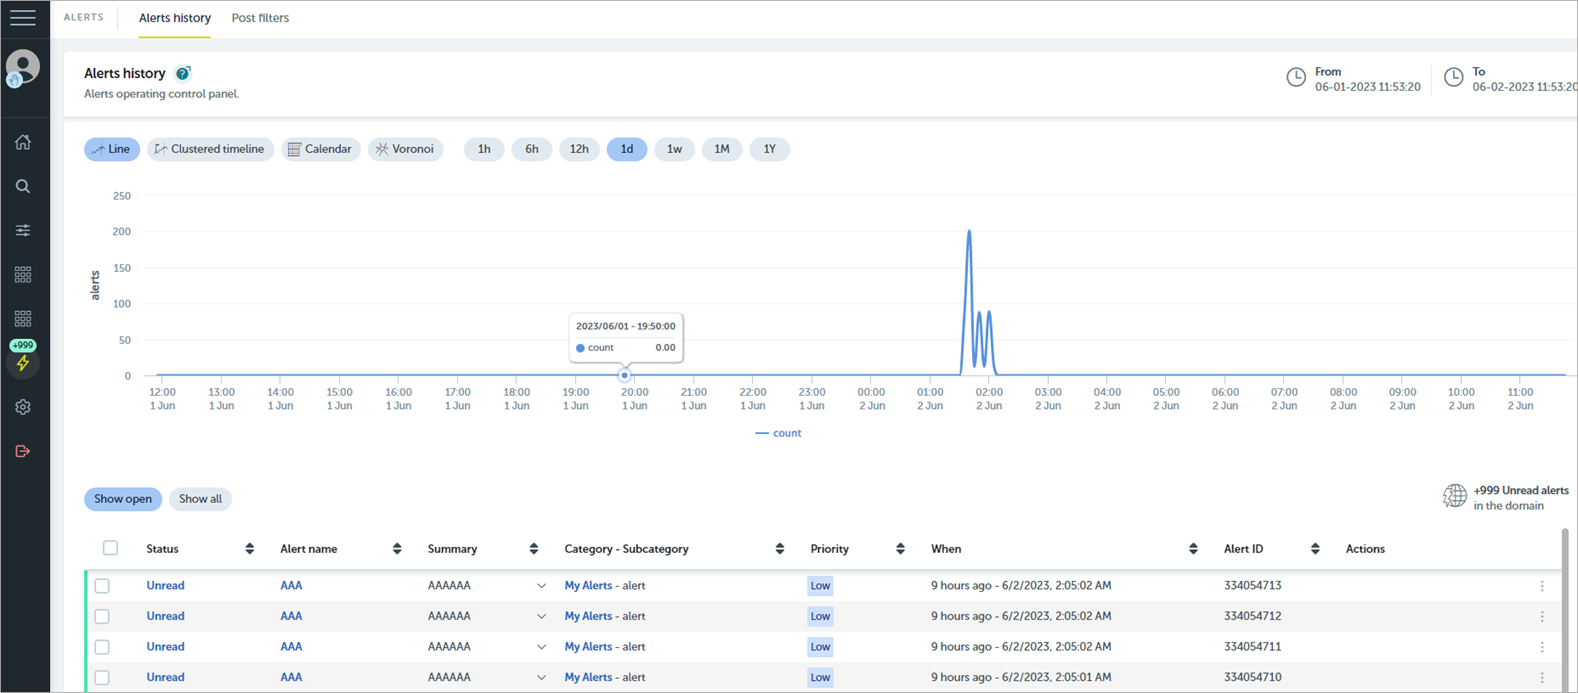
For more information on the Alerts Dashboard, go to Manage Available Alerts
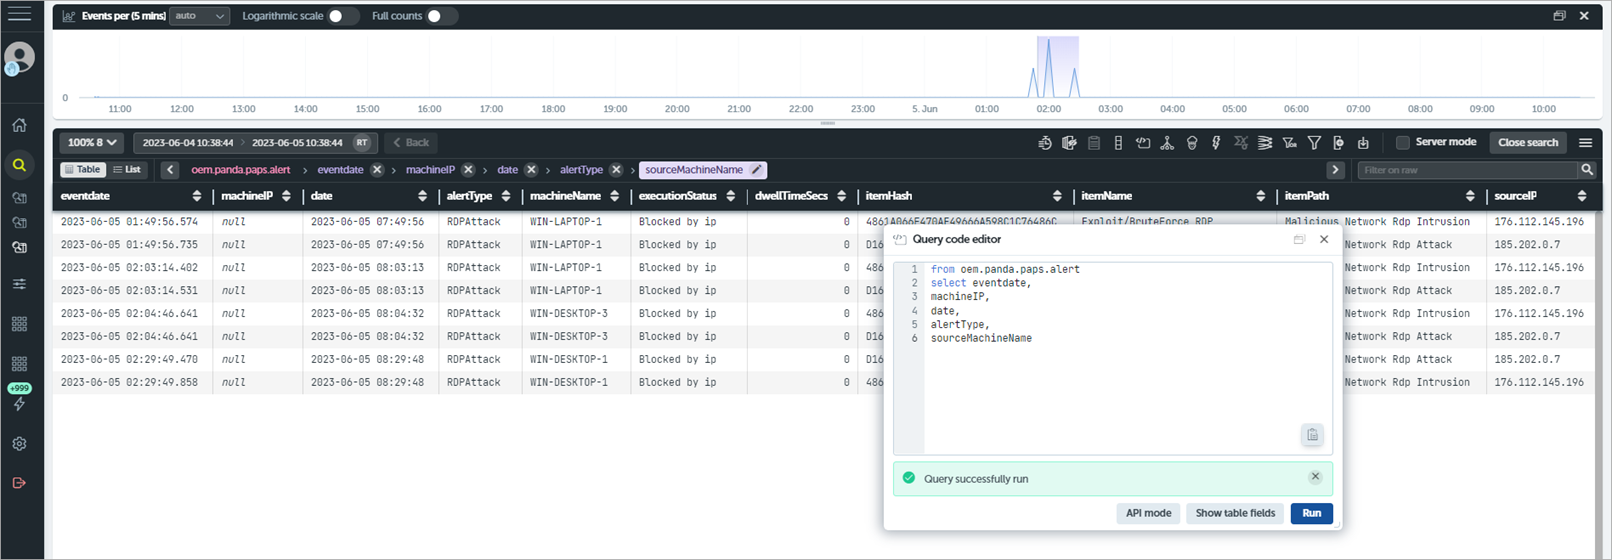
You create alerts on the Data Search page where you create queries.
For information on data tables, go to About Data Tables.
Your operator role determines what you can see and do in WatchGuard Cloud. Your role must have the Access File Access Information permission to view or configure this feature. For more information, go to Manage WatchGuard Cloud Operators and Roles.
To create an alert, from the Advanced Visualization Tool:
- From the left pane, select Data Search.
- Select the time period you want to create the alert for.
- Select the appropriate data table.
- To generate the information table you want, apply filters and data transformations.
- To show the exact settings of the data source that generates the data table and the specified time interval, click Toggle Query Editor.
- In the toolbar, click
 New Alert Definition.
 - Type a Summary to help identify the alert.
This text displays in the Alerts History. For more information, go to Advanced Visualization Tool Window. - Type a full Description for the alert.
When distributed by email, this text appears in the email body. In the Alerts History, you see this information when you use expand the Summary. - Type or select a Subcategory for the alert.
By default, alerts are grouped in the My Alerts group. - Type or select an Alert name.
When a triggered alert is distributed by email, this name is the email subject. - To specify the alert frequency, select a tab.
- To generate an alert for each event entry in the table, select Each.
- To generate a single alert for a number of events (threshold) during the specified time period, select Several.
- To generate a single alert when the number of events received (threshold) is less than indicated for the specified time period, select Low.
- (Optional) Create post filters.
Post filters enable you to edit the features of the generated alerts before they are sent, as well as delete them if they meet specified criteria. - Specify the delivery method.
The delivery method dictates how the Advanced Visualization Tool sends an alert and to whom. - (Optional) Create an anti-flooding policy.
An anti-flooding policy enables complete, temporary suspension of alert generation when the rate of alerts exceeds the threshold you define. - Create a sending policy and assign it to the alert you created.
The new alert is automatically associated with the default sending policy. Alert policies, also called sending policies, define how the Advanced Visualization Tool sends alerts.
After you create your alert, the Advanced Visualization Tool monitors its queries and an alert triggers when the specified conditions are met. You can see triggered alerts on the Alerts Dashboard tab of the Alerts page. For more information, go to Manage Available Alerts.