Connectivity Dashboard
Applies To: Wi-Fi Cloud-managed Access Points (AP125, AP225W, AP325, AP327X, AP420)
To view the Connectivity Dashboard, select Dashboard, then select the Connectivity tab.
The Connectivity Dashboard includes widgets to provide detailed information about wireless connectivity status:
- Client Journey — Provides an overview of client connectivity data including the number of active clients, client associations to APs, successfully authenticated clients, and total number of clients connected to the network.
- Baseline — Clients Affected by Failures — Provides a baseline of client connection activity and client connectivity failures.
- Clients by Most Failed Connections — Lists the top clients that failed to connect to the wireless network.
- Top Locations Affected by Failures — Lists the top five locations that are affected by association, authentication, or network failures.
Client Journey
The Client Journey widget indicates the current state of your wireless network for the selected location. You can quickly view:
- The status of wireless client activity, including the total number of active clients
- The total number of clients that tried to connect
- The number of associations to your APs
- The number of successfully authenticated clients
- The total number of clients connected to the network.
Hover the mouse over each phase of the client journey to see additional information. For example, if you hover the mouse over the Authentication phase, a tool tip displays information including the percentage of authenticated clients, the number of clients who failed to authenticate, and type of authentication failure.
Click on each phase of the client journey to view the detailed information for each phase. For example, if you click Association, you will be redirected to a page that provides detailed information for the clients that failed to associate to your network.
You can search for a client or AP by MAC address, IP address, user name, or device name.
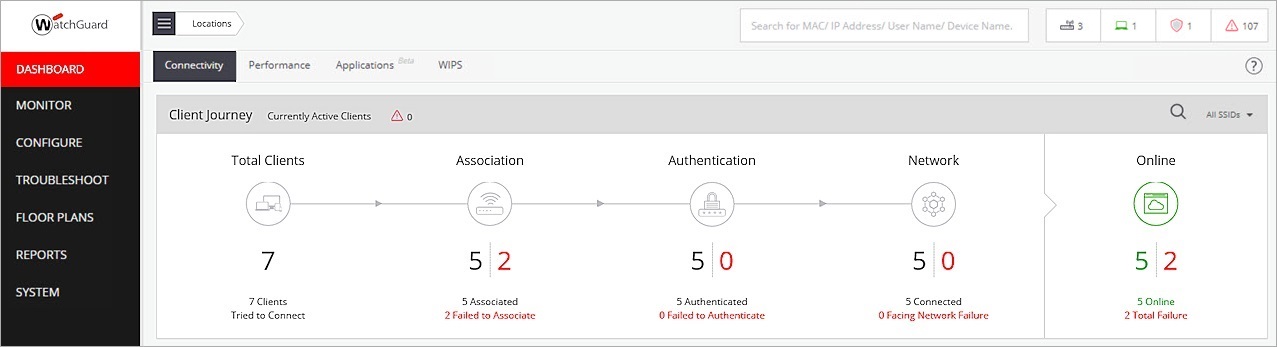
The client journey on the Connectivity Dashboard includes the following information:
Total Clients
The Total Clients section provides the number of clients that connected or tried to connect to the network. It includes the total number of clients that associated with an SSID on the network and the total number of clients that failed to associate. Click this section to view a detailed list of clients.
Association
The Association section provides the total number of clients that are successfully associated to a Wi-Fi network and the total number of clients that failed to associate. Click this section to view a detailed list of clients that failed to associate.
Authentication
The Authentication section provides the total number of successfully authenticated clients and the clients that failed to authenticate to the Wi-Fi network. Click this section to a view a detailed list of clients that failed to authenticate.
Network
The Network section provides the total number of clients that successfully accessed or failed to access network services such as DHCP, DNS, and AAA (Authentication, Authorization, Accounting) servers. Click this section to see a detailed of clients that failed to access network services.
Online
The Online section provides the total number of online clients that successfully connected to the Wi-Fi network and the total number of clients that failed to authenticate, associate, or access the network.
Connectivity Failures
These types of connectivity failures are logged for each category of the client journey:
| Failure Categories | Failure Type |
|---|---|
|
Association Failure |
|
|
Authentication Failure |
|
| Network Failure |
|
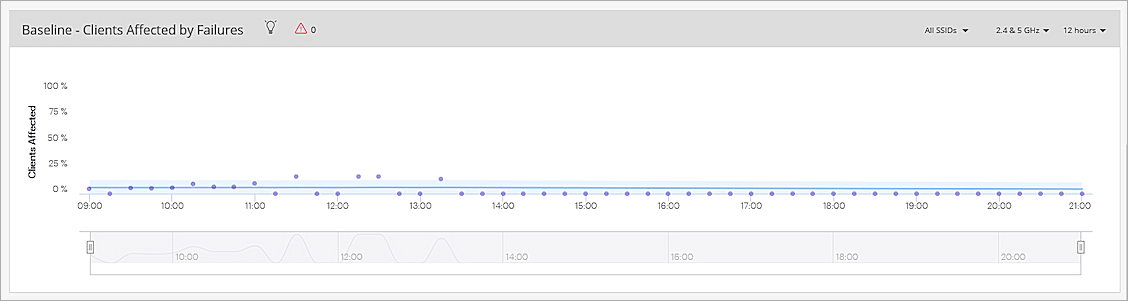
Baseline — Clients Affected by Failures
Discover calculates a baseline for the percentage of clients that failed to connect to the wireless network.
You can select the SSID, frequency band, and time interval from the top-right corner of the widget. The graph is updated every 15 minutes.
For more information on how to read baseline charts in Discover, see Baseline Charts and Anomaly Detection.
Clients by Most Failed Connections
The Clients by Most Failed Connections widget lists the top clients that failed to connect to the wireless network and the number of connection failures for each client. You can select the time interval from the top-right corner of the widget.
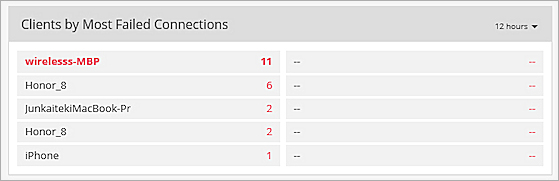
Click a client name to display the Client Connections Logs widget for detailed information of the connection failures for the client. For more information. see Client Connection Logs.
Top Locations Affected by Failures
The Top Locations Affected by Failures widget uses a horizontal bar graph to indicate the top five locations affected by association, authentication, or network connection failures. The graph contains the data for the selected parent location and its immediate child folders.
You can filter the failure type (Association, Authentication, or Network) from the drop-down list at the top-right corner of the widget.
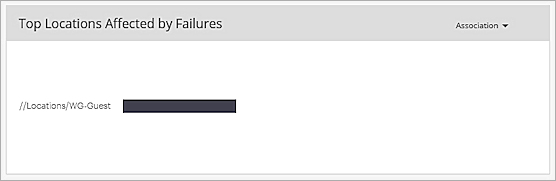
Hover the mouse over a graph bar to see the number of clients affected by connectivity failures compared with the total number of clients associated to an AP at that location.
Click a graph bar to see detailed information on the clients affected by connection failures at that location.