Monitor Bandwidth by Traffic Management Action
You can view the bandwidth statistics for traffic managed by each Traffic Management Action and see which policies and applications use each action. You can also view bandwidth statistics, such as the current bandwidth usage as a percentage of the configured maximum for the Traffic Management Action.
To see the Traffic Management statistics:
- Select System Status > Traffic Management.
The Traffic Management status page appears.

The table at the bottom provides a quick summary of current traffic statistics for the configured Traffic Management Actions.
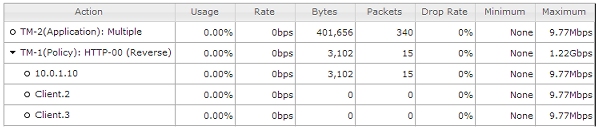
- The Action column shows whether the action applies to traffic for one or more policies or Application Control Actions.
- The Usage column shows how much of the maximum bandwidth is currently used. It is the Rate divided by the Maximum.
- The Rate column shows the current data rate for the traffic handled by each action.
- The Bytes column shows the current number of bytes for traffic handled by each action.
- The Drop Rate column shows the historical drop rate for packets handled by each action. The Drop Rate statistic is an average percentage of packets dropped for all traffic handled by the Traffic Management Action since it was created or last modified, or since the last time the device rebooted. Position the mouse over this column to see the number of dropped packets and the total number of packets handled by this action.
- The Minimum and Maximum columns show the Guaranteed Bandwidth and Maximum Bandwidth configured for each action.
In Traffic Management statistics, 1 Kbps is equal to 1024 bits per second.
- Select an action to see more information about it.
A dialog box shows a list of the policies and applications the action applies to, and the graph shows the Rate for the selected action
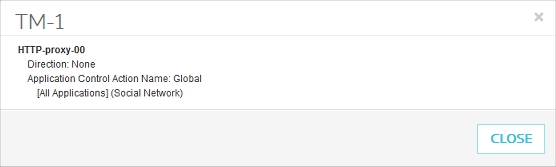
For each policy an action applies to, the dialog box shows:
Direction
The traffic direction the action applies to. It can be:
- Forward — The action is configured as the Forward Action in the policy.
- Reverse — The action is configured as the Reverse Action in the policy.
- Both — The action is configured as both the Forward Action and the Reverse Action in the policy.
- None — The action is not configured as either the Forward Action or the Reverse Action, but is used in the Application Control Action used by the policy. For applications, the action applies to traffic in both directions.
Application Control Action Name
The name of the Application Control Action the policy uses, if the Application Control Action uses the Traffic Management Action. Below the Application Control Action Name, is a list of applications the Traffic Management Action applies to. If the action is used for an application category, the application name is shown as [All Applications] followed by the application category name. For applications, the action applies to application traffic in both directions.
- For a Per IP Address Traffic Management Action, expand the action to see a list of client instances and the bandwidth used by each instance. The number of instances is based on the Maximum Instance configured in the action.
For more information about the Traffic Management System Status page, go to Traffic Management.
To see the bandwidth statistics for traffic managed by each Traffic Management Action, from Policy Manager:
- In Firebox System Manager, select the Traffic Management tab.
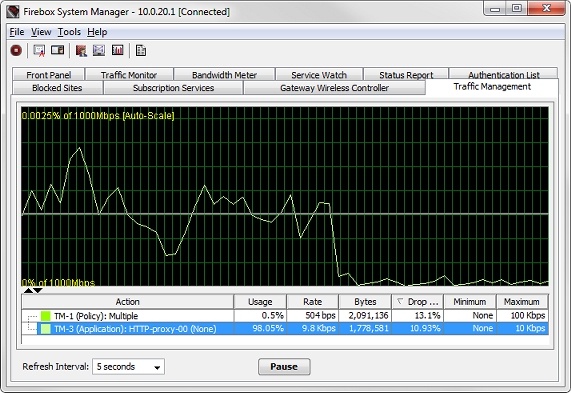
The table at the bottom provides a brief summary of current traffic statistics for the configured Traffic Management Actions.
- The Action column shows whether the action applies to traffic for one or more policies or Application Control Actions.
- The Usage column shows how much of the maximum bandwidth is currently used. It is the Rate divided by the Maximum.
- The Rate column shows the current data rate for traffic handled by each action.
- The Bytes column shows the current number of bytes for traffic handled by each action.
- The Drop Rate column shows the historical drop rate for packets handled by each action. The Drop Rate statistic is an average percentage of packets dropped for all traffic handled by the Traffic Management Action since it was created or last modified, or since the last time the device rebooted. Position the mouse over this column to see the number of dropped packets and the total number of packets handled by this action.
- The Minimum and Maximum columns show the Guaranteed Bandwidth and Maximum Bandwidth configured for each action.
In Traffic Management statistics, 1 Kbps is equal to 1024 bits per second.
- Click an action in the table to display the rate graph for the action.
- Position the mouse over an action name to see more information about it.
A pop-up box shows a list of the policies and applications the action applies to.
The pop-up box shows the traffic direction that the action applies to, in parentheses after each policy name. For each policy, the direction can be:
- Forward — The action is configured as the Forward action in the policy.
- Reverse — The action is configured as the Reverse action in the policy.
- Both — The action is configured as both the Forward action and the Reverse action in the policy.
- None — The action is not configured as either the Forward Action or the Reverse action, but is used in the Application Control Action used by the policy. For applications, the action applies to application traffic in both directions.
If Traffic Control is used in the Application Control Action used by the policy, the pop-up box also shows a list of applications the Traffic Management Action applies to. If the action is used for an application category, the application name is shown as [All Applications] followed by the application category name.
- For a Per IP Address Traffic Management Action, expand the action to see a list of client instances and the bandwidth used by each instance. The number of instances is based on the Maximum Instance configured in the action.