Traffic Management
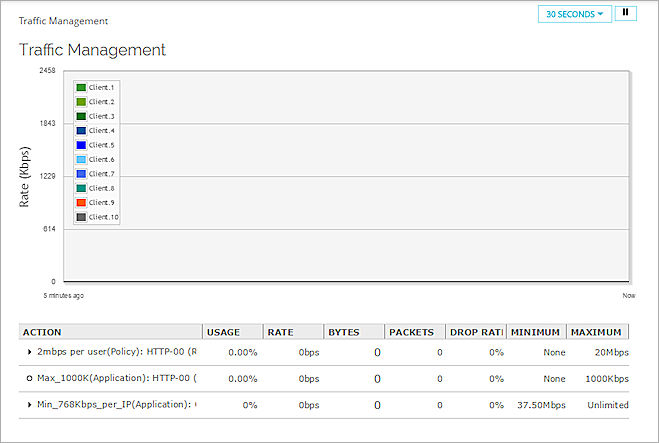
On the System Status > Traffic Management page, you can see the bandwidth statistics for the traffic managed by traffic management actions configured on your Firebox. The statistics include details about which policies and applications use each Traffic Management action. The current bandwidth usage also appears, and is shown as a percentage of the configured maximum bandwidth for the Traffic Management action. In the statistics, 1 Kbps is equal to 1024 bits per second.
To see Traffic Management statistics:
Select System Status > Traffic Management.
The statistics appear for each Traffic Management action that you have configured .
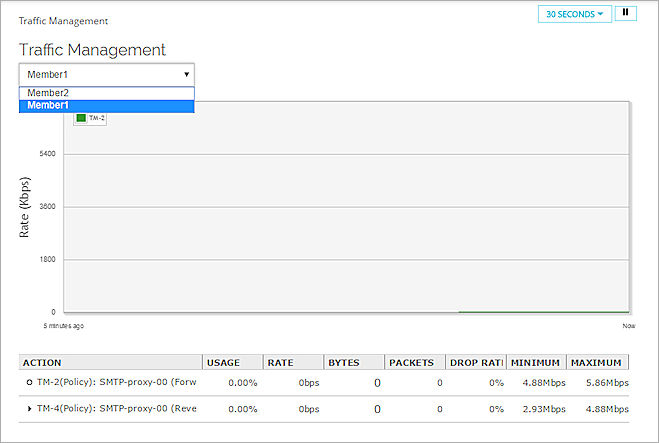
If you connect to a FireCluster, on the Traffic Management page, you can select which cluster member to view.
To choose which cluster member to see on the Traffic Management page:
From the Member drop-down list, select a cluster member.
The Traffic Management page includes a chart and table that show these statistics:
Action
The name of the Traffic Management action.
Usage
The amount of the maximum bandwidth that is currently in use. It is the Rate value divided by the Maximum value.
Rate
The current data rate for traffic managed by this action.
Bytes
The current number of bytes for traffic managed by this action.
Packets
The total number of packets.
Drop Rate
The historical drop rate of packets managed by this action. The Drop Rate statistic in the average percentage of packets dropped for all traffic managed by this action since it was created, last modified, or the device was rebooted.
Minimum
The minimum guaranteed bandwidth configured for this action.
Maximum
The maximum bandwidth configured for this action.
To see more information for any Traffic Management action that appears in the table:
From the table, select a Traffic Management action.
A dialog box appears with more information about that action.
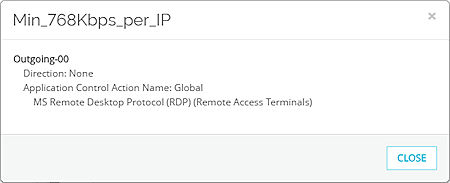
The Traffic Management action information dialog box includes these details:
Direction
The traffic direction the action applies to:
- Forward — The action is configured in the policy as the Forward Action.
- Reverse — The action is configured in the policy as the Reverse Action.
- Both — The action is configured in the policy as both the Forward Action and the Reverse Action.
- None — The action is not configured as either the Forward Action or the Reverse Action, but is used in the Application Control action specified in the policy. For applications, the action applies to traffic in both directions.
Application Control Action Name
The name of the Application Control action specified in the policy, if the Application Control action uses the Traffic Management action.
Below the Application Control Action Name, the list of applications the Traffic Management action applies to appears. If the action is used for an application category, [All Applications] appears for the application name, followed by the application category name. For applications, the action applies to application traffic in both directions.
For information about Traffic Management, see About Traffic Management and QoS.
For more information about the System Status pages, see Monitor your Firebox with Fireware Web UI.