Applies To: Locally-managed Fireboxes
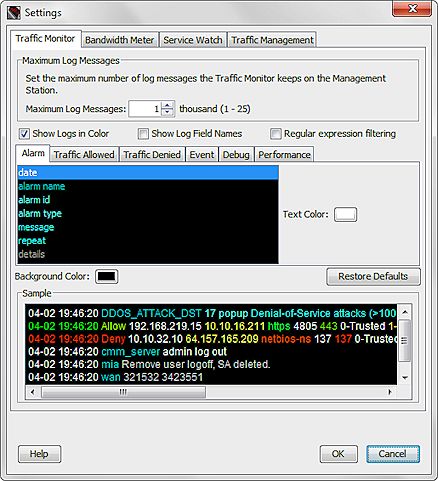
You can customize the appearance of Traffic Monitor. You can select the background color for the windows, the text color for log types, whether to show log messages in color, whether to show the names of the log fields, enable the use of regular expressions when you filter log messages, and set the maximum number of log messages.
To change Traffic Monitor settings, in Firebox System Manager:
- Start Firebox System Manager.
- Select File > Settings.
Or, right-click anywhere on the display and select Settings.
The Settings dialog box opens. - Configure the settings as described in the next sections.
- Click OK.
Set the Maximum Number of Log Messages
From the Settings dialog box, you can change the maximum number of log messages that appear in Traffic Monitor at the same time. The default value is one thousand. You can select a value from one thousand to 25 thousand log messages.
When the maximum number is reached, new log messages replace the oldest entries. If you have a slow processor or a small quantity of RAM, we recommend you specify a lower value because a high value can slow your management computer.
To examine a large volume of log messages, we recommend that you use Log Manager to review your log messages. For more information, go to View Device Log Messages in WebCenter and See Log Messages & Reports in WebCenter.
- Select the Traffic Monitor tab.
- In the Maximum Log Messages text box, type or select the maximum number of log messages.
Show Log Field Names
You can enable Traffic Monitor to include labels for log message fields, such as src_ip, dst_ip, and src_port.
- Select the Traffic Monitor tab.
- Select the Show Log Field Names check box.
Enable Regular Expression Filtering
By default, Traffic Monitor filters all log messages with a literal string search. For example, if you type 10.1 in the filter drop-down list, the log messages are filtered to only include entries with the characters 10.1. To use regular expressions when you filter Traffic Monitor data, you must enable Traffic Monitor to use regular expressions.
- Select the Traffic Monitor tab.
- Select the Regular expression filtering check box.
For more information on how to create regular expressions, go to About Regular Expressions. For examples of usage of regular expressions in Traffic Monitor, go to Search Logs in Traffic Monitor with Regular Expressions.
Use Color for Log Messages
In Traffic Monitor, you can make messages appear in different colors. You can use different colors to differentiate between types of information. On the Alarm, Traffic Allowed, Traffic Denied, Event, Debug, and Performance tabs, you can select a color for each message type.
- Select the Traffic Monitor tab.
- To disable all colors in the display, clear the Show Logs in Color check box.
- Select a tab: Alarm, Traffic Allowed, Traffic Denied, Event, Debug, or Performance.
- Select a log message information category from the list.
The current color for the selected category opens in the Text Color color control box. - To change the color, click the Text Color color control box.
The Traffic Monitor Field Color dialog box opens. - Select a color. A sample of how the color will look in Traffic Monitor appears in the Sample window at the bottom of the dialog box.
- Click OK to close the dialog box, or Reset to use the previous color.
Select a Background Color for Traffic Monitor
In the Settings dialog box:
- Select the Traffic Monitor tab.
- Click the Background Color color control box.
The Traffic Monitor Background Color dialog box opens. - Select a color.
A sample of how the color will look in Traffic Monitor appears in the Sample section at the bottom of the dialog box. - Click OK to close the dialog box, or Reset to go back to the previous color.
- To cancel your changes and return to the default background color, click Restore Defaults.
Copy Messages to Another Application