Applies To: WatchGuard Advanced Reporting Tool
The Data Access Control dashboard shows the data that leaves your network. Use the Data Access Control dashboard to detect data leaks and theft of confidential information, identify high bandwidth consumers, and monitor file access and execution activity.
The tabs in the dashboard show information about bandwidth usage and access to documents by applications installed across the network, such as:
- Files that network users most commonly access.
- Calendar charts and maps that show the data sent over the last year.
- Which users access specific computers on the network.
- Countries that receive the highest number of connections from your network, which can help you to identify malicious activity.
Your operator role determines what you can see and do in WatchGuard Cloud. Your role must have the Access Advanced Security Information permission to view or configure this feature. For more information, go to Manage WatchGuard Cloud Operators and Roles.
To open the Data Access Control dashboard:
- In WatchGuard Cloud, select Monitor > Endpoint Security.
- Select Status > Advanced Visualization Tool.
- From the left pane, select Advanced Reporting > Data Access Control.
- Select a time period to filter the data on.

- Click Refresh.
The dashboard shows information for the time period selected.
There are four tabs in the Data Access Control dashboard:
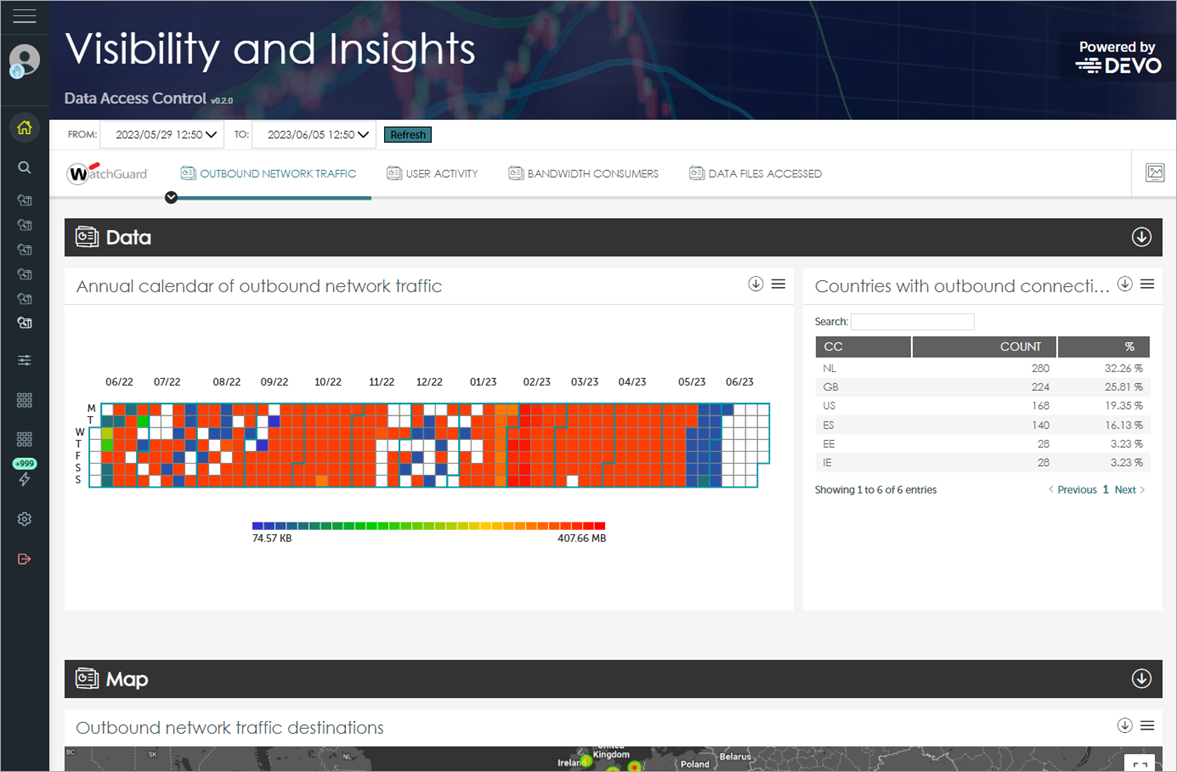
Outbound Network Traffic
The Outbound Network Traffic tab displays information about the volume of data sent out from the network.
These tiles are available on the Outbound Network Traffic tab:
Annual Calendar of Outbound Network Traffic
This tile shows the evolution of data sent from the network. The graph helps you identify the days of the month during which network computers sent an abnormally high volume of data.
Countries with Outbound Connections
This tile identifies the ten countries that received the most connections from the customer network. A strong indication of potential problems is when you view countries on the list with which your company does not normally have a commercial relationship.
Outbound Network Traffic Destinations
This tile shows a map of the destinations of network traffic. The map uses dots to indicate the volume of data sent from the network to the countries in the map. The color and diameter of the dots represent the volume of data sent.
User Activity
The User Activity tab shows information about network user activity. The Logged-In Users graph shows the computers accessed by each user account on the network.
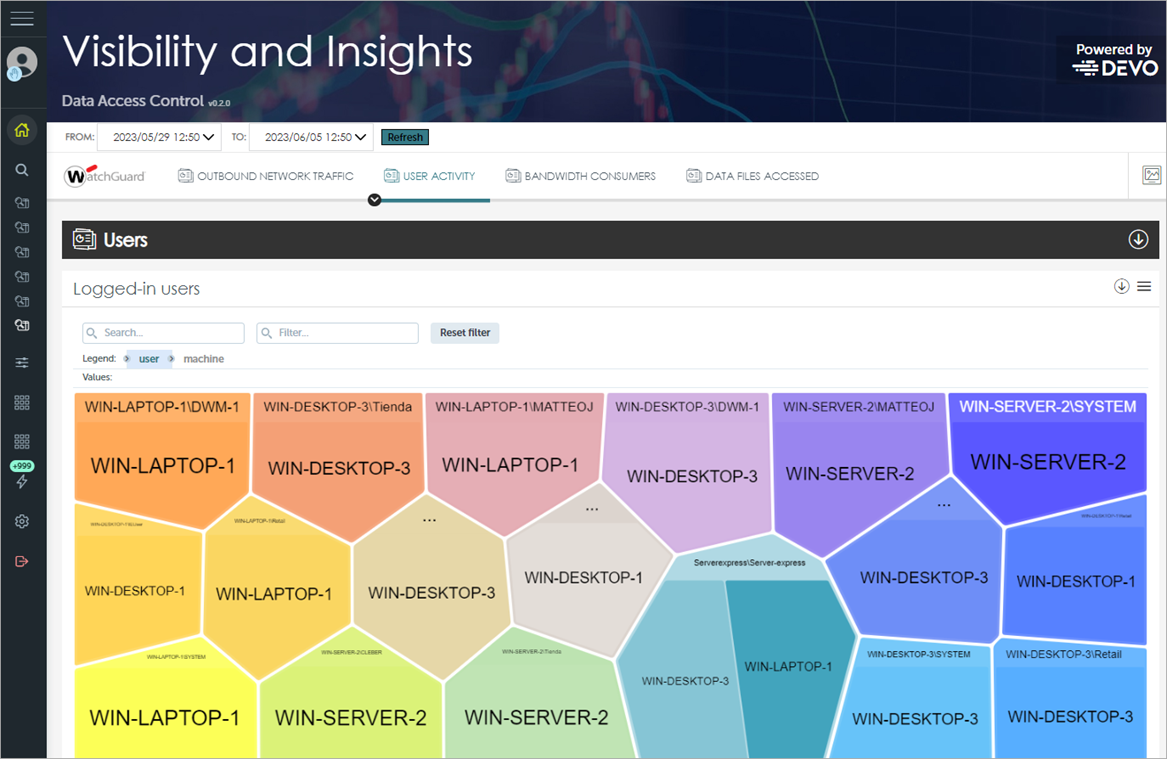
To determine which user accounts have accessed each computer, change the order in the legend bar to machine, user. For more information on how to use a Voronoi chart, go to About Voronoi Charts.
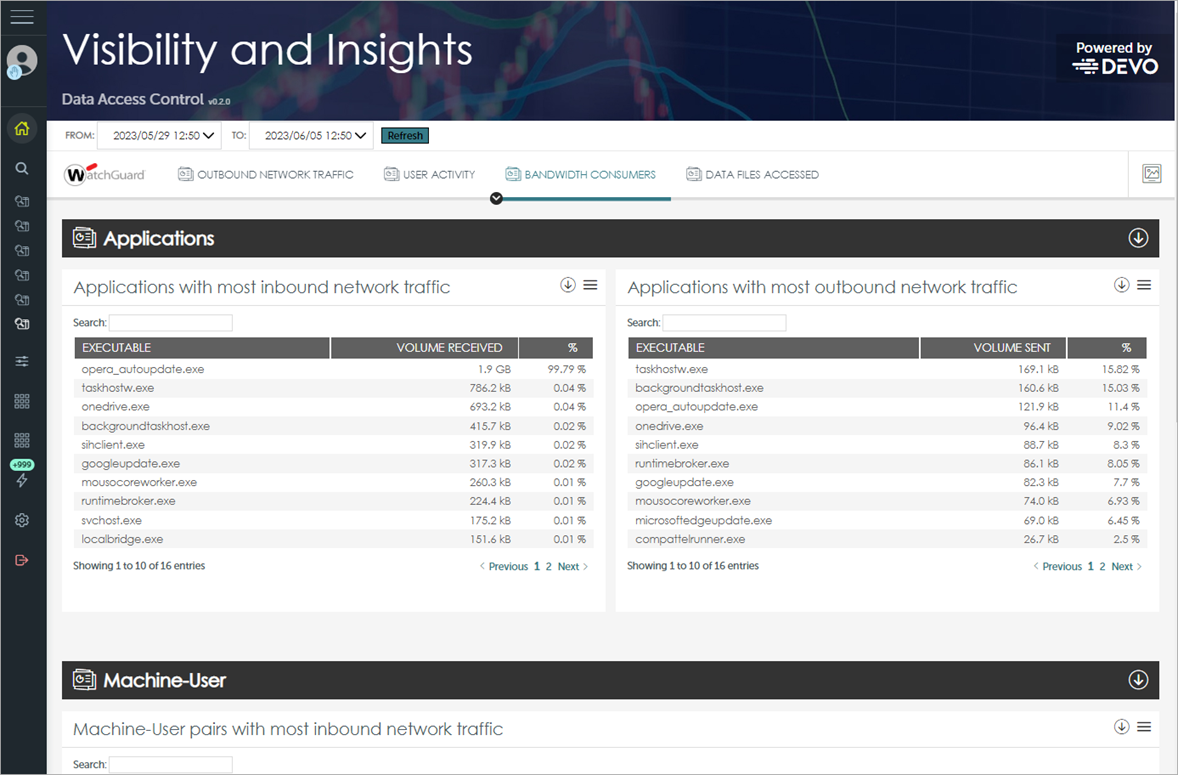
Bandwidth-Consumers
The Bandwidth-Consumers tab identifies the processes and users that consumed most network bandwidth. Tables contain a maximum of 1,000 records, sorted in descending order.
These tiles are available on the Bandwidth-Consumers tab:
Applications with Most Inbound Network Traffic
This tile shows applications that receive most inbound traffic on the network.
Applications with Most Outbound Network Traffic
This tile shows applications that send most outbound traffic on the network.
Machine-User Pairs with Most Inbound Network Traffic
This tile shows the machine-user pairs that receive most inbound traffic on the network.
Machine-User Pairs with Most Outbound Network Traffic
This tile shows the machine-user pairs that send most outbound traffic on the network.
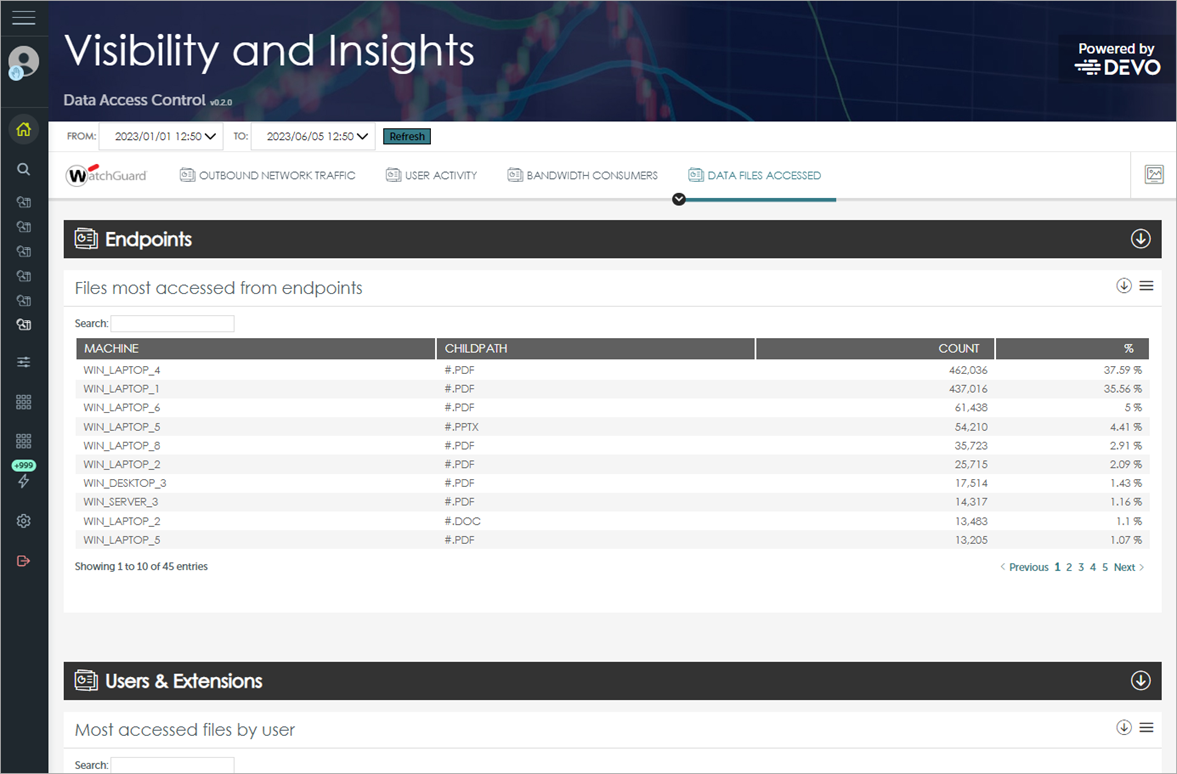
Data Files Accessed
The Data Files Accessed tab identifies the files accessed by users on the customer network. With the data provided in this section, you have access to some Data Leak Detection (DLD) features. Tables contain a maximum of 1,000 records, sorted in descending order.
These tiles are available on the Data Files Accessed tab:
Files Most Accessed from Endpoints
This tile shows the files most accessed by network endpoints.
Most Accessed Files by User
This tile shows the files most accessed by network users.
Most Executed Extensions
This tile shows the extensions most frequently run on the network, either individually (executable file extensions), or as data files opened by programs (such as Office files and compressed files).
Users and Outbound Data Hourly
This tile shows the volume of data sent by each user in the last 24 hours.
Monitor Outbound Network Traffic