Applies To: WatchGuard Advanced Reporting Tool and Data Control
A Voronoi chart shows information from a data table in groups of data. It uses polygons of various shapes and sizes where the polygon area represents a relative percentage of the items shown inside the polygon.
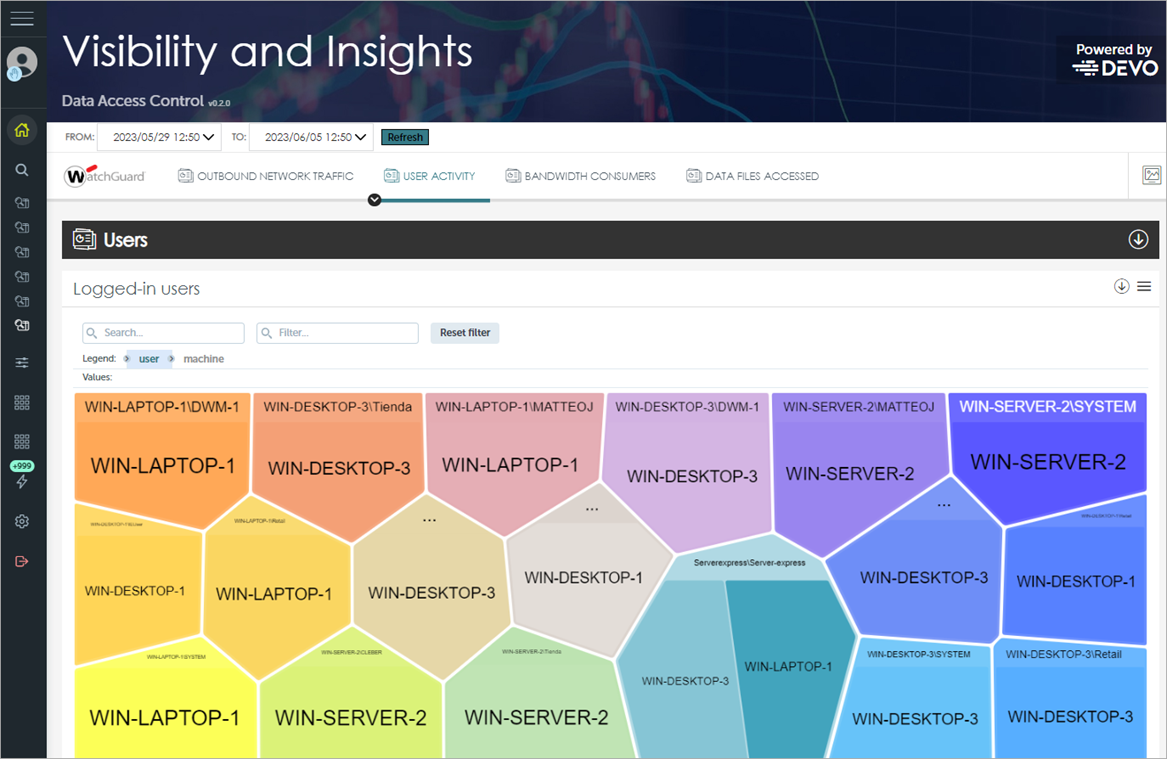
A polygon can comprise other polygons that represent groups of lower-level data.
- To access lower-level data, double-click a polygon.
- To return to the previous level, double-click with the right-mouse button.
- To see the number of items in the group and the percentage that they represent of the total items, point to a group.
Chart Controls
Above the Voronoi chart, you can use the chart controls to filter and pivot the data in the chart.
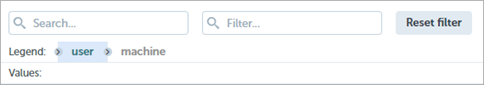
Search Bar
Use the Search bar to find a polygon in the Voronoi diagram, and expand it to show the groups. You can also double-click a polygon.
To undo a search, double-click a polygon with the right-mouse button.
Filter Bar
Use the Filter bar to show the polygons that contain groups that match the filter criteria.
Reset Filter
To clear the filter, click Reset Filter. This option does not undo searches. To undo a search, double-click a polygon with the right-mouse button.
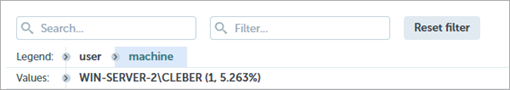
Legend Bar
The legend bar includes the data table tags used to group the information. The order of the tags indicates the group hierarchy. You can drag the tags to the left or right in the legend bar to pivot the data and establish a new hierarchy.

In a Voronoi chart, the highlighted tag in the legend bar represents the selected polygon. The adjacent tags indicate the data layer that will open when you double-click a polygon.
Values Bar
In combination with the tags shown in the legend bar, the values bar below the legend bar indicates the value of a specific field. When you select a polygon, the Values bar shows the value of the search or selected polygon.