Applies To: ThreatSync
The Incident Details page in ThreatSync shows detailed information about a specific threat. You can view the incident name, associated account, risk score and level, and sections that provide details and response actions specific to the incident.
Your operator role determines what you can see and do in WatchGuard Cloud. Your role must have the ThreatSync Core permission to view or configure this feature. For more information, go to Manage WatchGuard Cloud Operators and Roles.
You can perform actions on the selected incident in various sections on the Incident Details page. For more information, go to Perform Actions in ThreatSync.
To open the Incident Details page, in ThreatSync:
- Select Monitor > Threats > Incidents.
The Incidents page opens. - Click an incident.
The Incident Details page for that incident opens.
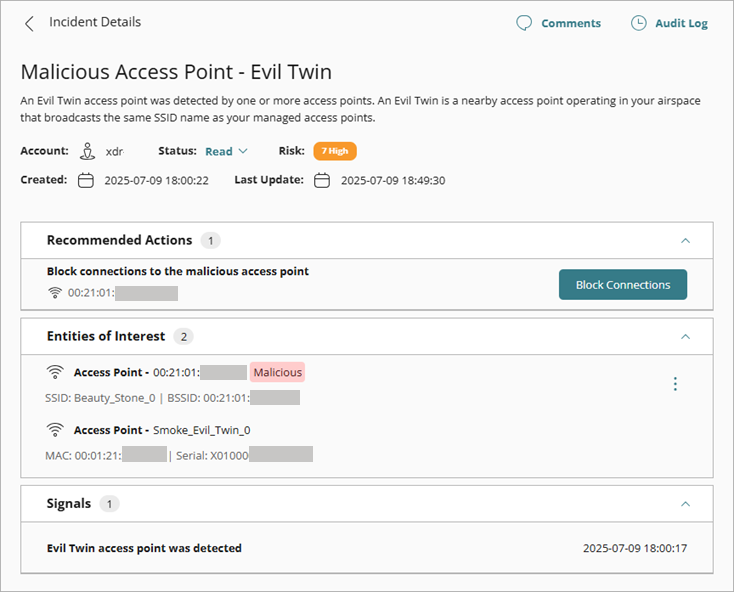
The Incident Details page includes these sections:
- Incident Type and General Information for Incidents in ThreatSync
- Threat Activity Graph
- Automatic Response for Incidents in ThreatSync
- Recommended Actions for Incidents in ThreatSync
- Entities of Interest for Incidents in ThreatSync
- Signals for Incidents in ThreatSync
- Comments on Incidents in ThreatSync
- Audit Log for Incidents in ThreatSync
Incident Type and General Information for Incidents in ThreatSync
The incident type and name of the detected threat appear at the top of the page.

ThreatSync supports these incident types:
- Advanced Security Policy — Unauthorized or unexpected activity on your network, including execution of malicious scripts and unknown programs that use advanced infection techniques, traffic to dangerous websites, unauthorized applications and countries, unauthorized incoming traffic, or unauthorized traffic between internal networks.
- Exploit — Attacks that try to inject malicious code to exploit vulnerable processes.
- Intrusion Attempt — A security event where an intruder tries to gain unauthorized access to a system.
- IOA — Indicators of Attack (IOAs) are indicators that are highly likely to be an attack.
- Malicious URL — A URL created to distribute malware, such as ransomware.
- Malicious IP — An IP address associated with malicious activity.
- Malware — Malicious software designed to damage, disrupt, and gain unauthorized access to computer systems.
- PUP — Potentially Unwanted Programs (PUPs) that might install when other software installs on a computer.
- Virus — Malicious code that enters computer systems.
- Unknown Program — Program blocked because it has not yet been classified by WatchGuard Endpoint Security. For more information on what happens when Endpoint Security reclassifies an Unknown Program, go to Unknown Programs and Incident Reclassification.
- Malicious Access Point — An unauthorized wireless access point connected to your network or operating in your airspace.
- Credential Access — AuthPoint incident that indicates an attempt to compromise account credentials.
For more information on specific incident types, go to Incident Types and Triggers in ThreatSync.
A description of the incident appears below the incident type, followed by general information about the incident.

This information is available for all incidents:
- Account — The account associated with the incident.
- Status — The status of the incident. Incidents can have one of these statuses: New, Read, or Closed. For more information, go to Close or Change the Status of Incidents.
- Risk — The risk score and level of the incident. For more information, go to Risk Scores and Risk Levels in ThreatSync
- Created — The date and time the incident was first detected.
- Last Update — The time and date the incident was last updated. This only appears on the Incident Details page when the incident status changes or when the signals related to threat are updated.
- Signal Sources — The original detection point that identified a security event and sent it to ThreatSync to create the incident.
Threat Activity Graph
Some Endpoint Security Indicators of Attack (IOA) incidents include a Threat Activity Graph tab at the top of the page and button below the general information section. The threat activity graph is an interactive diagram of the sequence of events that led to the generation of the IOA. Incident Responders can use the graph to help identify the root cause of an attack. Click the button to open the threat activity graph for the incident.
The Threat Activity Graph button and tab only appear when available for the incident. If no threat activity graph exists for the incident, the button and tab do not appear on the Incident Details page.

For more information about Threat Activity Graphs, go to About Threat Activity Graphs in ThreatSync.
Automatic Response for Incidents in ThreatSync
When an integrated product, such as Endpoint Security, Firebox, AuthPoint, or an access point, takes automatic action in response to a threat, the Automatic Response section appears on the Incident Details page. This section lists the automatic responses already taken in response to the threat.
The Automatic Response section only appears when an automatic response action occurs. If no automatic response action exists for an incident, this section does not appear on the Incident Details page.

Automatic responses can include:
- Allowed (Audit Mode) — Incident detected, but because the device is in Audit mode, no action was taken.
- Connection Blocked — Connection blocked.
- Device Isolated — Communication with device is blocked.
- File Deleted — File was classified as malware and deleted.
- IP Blocked — Network connections to and from this IP address are blocked.
- Connections to Access Point Blocked — Wireless client connections to this malicious access point are blocked.
- Process Blocked — Process blocked by an endpoint device.
- Process Killed — Process ended by an endpoint device.
- User Disabled in Microsoft 365 — Advanced Security Policy incident in which the user was disabled in Microsoft 365.
- User Blocked in AuthPoint — Credential Access incident in which the user was blocked in AuthPoint.
Recommended Actions for Incidents in ThreatSync
The Recommended Actions section shows the actions WatchGuard recommends you perform to respond to the incident. Click a recommended action to perform it manually. For more information, go to Perform Actions in ThreatSync.

Recommendations for an incident on the Incident Details page determine what actions are available in the Actions drop-down list on the Incidents page. For example, if the recommended action for an incident is to isolate a device, the Isolate/Stop isolating device option is enabled in the Actions drop-down list on the Incidents page for that incident.
Entities of Interest for Incidents in ThreatSync
The Entities of Interest section shows all the unique objects related to the incident. Objects related to the incident include:
- IP addresses
- URLs
- Files
- Users
- Endpoints
- Devices
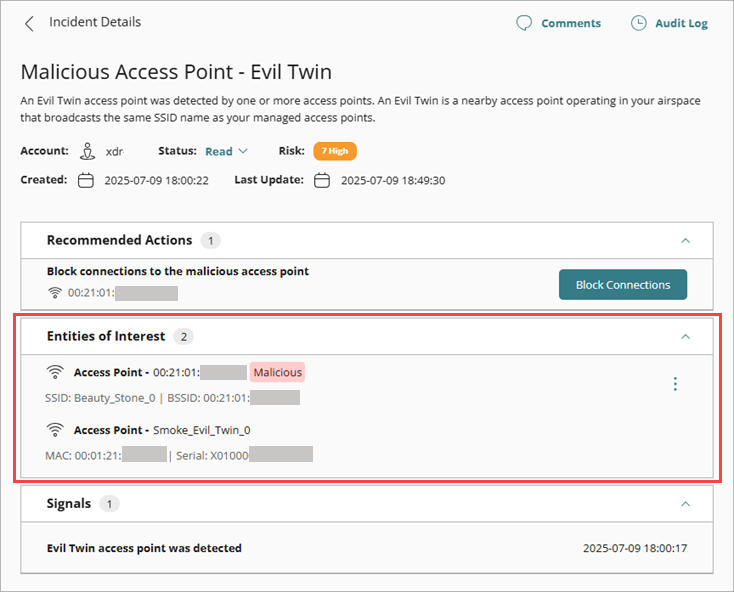
When actions are available for an entity, a menu icon appears next to that entity. Click the ![]() icon to open the list of available actions for that entity.
icon to open the list of available actions for that entity.

For more information, go to Perform Actions in ThreatSync.
Signals for Incidents in ThreatSync
The Signals section lists the raw events (signals) that ThreatSync combines to create the incident.
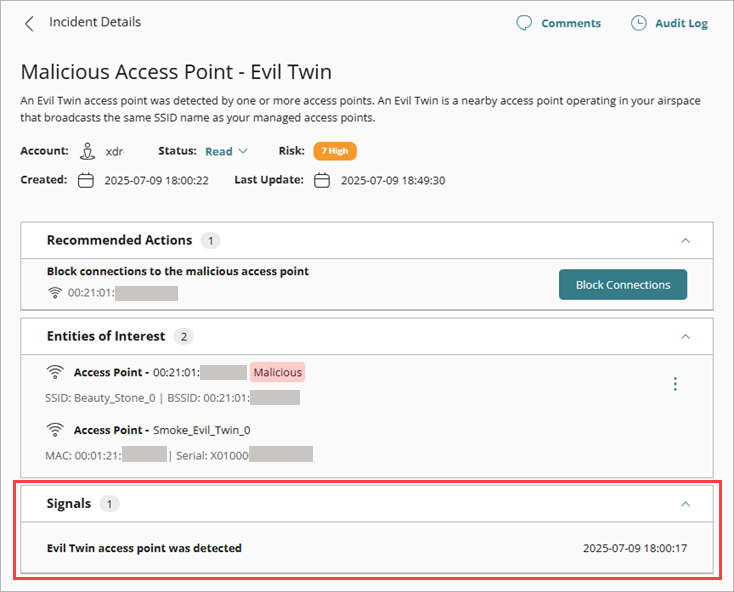
Select a signal in the list to open the signal details pane. The signal name appears at the top of the pane, followed by the raw data received by ThreatSync for the signal. The data that appears in this pane varies based on the incident type and the data received for that signal.

Comments on Incidents in ThreatSync
When you review and respond to incidents, you can add comments for other Incident Responders to view and respond to. Comments appear in the Comments pane of the Incident Details page and enable responders to communicate and document incident activity.
When you change the status of or perform an action on an incident, a dialog box opens with a text box to add an optional comment. These comments also appear in the Comments pane. For more information, go to Perform Actions in ThreatSync and Close or Change the Status of Incidents.
For customers with WatchGuard Total MDR or WatchGuard Open MDR, comments made in ThreatSync do not appear in the Managed Services portal. To send a comment about an investigation to the WatchGuard SOC Team, use the Managed Services portal. For more information, go to Respond to an Investigation.
The Comments pane is minimized by default. Click Comments on the Incident Details page to open the Comments pane.

The Comments pane includes:
- Search — Type text in the search box to filter comments by user name or keyword.
- Sort — Click
 to sort comments by date. Most recent comments appear first, by default.
 - Comments — View the comments for the incident. Click
 to edit or delete the comment. Comments include this information:
- Commenter user name
- Date and time of comment
- Status change or action performed, if any
- Enter a Comment — Enter new comments in this text box.
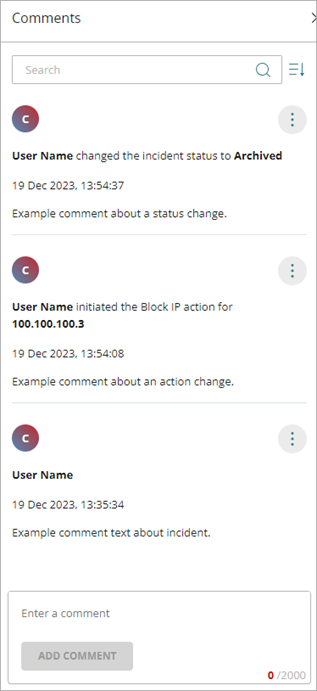
You can add comments directly to an incident on the Incident Details page. You can also add comments to an incident when you perform an action or change the incident status. For more information, go to Perform Actions in ThreatSync and Close or Change the Status of Incidents.
- Select Monitor > Threats > Incidents.
The Incidents page opens. - Click an incident.
The Incident Details page opens. - Click Comments.
The Comments pane opens.
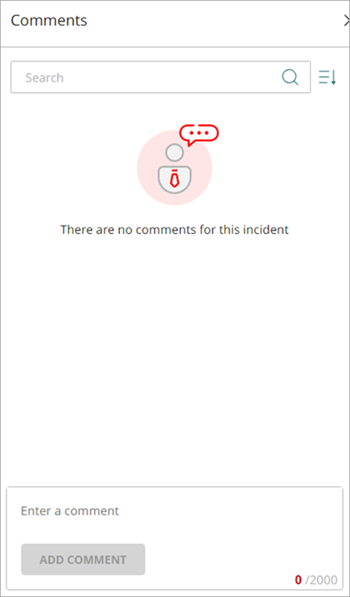
- In the Enter a Comment text box, type your comment.
- Click Add Comment.
The new comment appears in the Comments pane.
You cannot edit comments made by other users.
- Select Monitor > Threats > Incidents.
The Incidents page opens. - Click an incident.
The Incident Details page opens. - Click Comments.
The Comments pane opens. - Find the comment you want to edit and click
 .
. - From the drop-down list, select Edit.
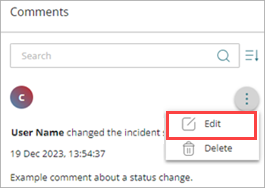
- In the text box, enter your changes.
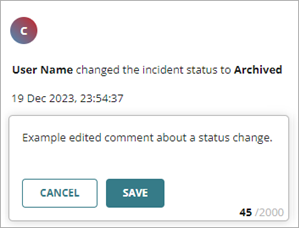
- Click Save.
Audit Log for Incidents in ThreatSync
The incident audit log appears in the Audit Log pane of the Incident Details page and enables you to view and search all actions and events associated with the incident. The Audit Log pane is minimized by default. Click Audit Log on the Incident Details page to open the pane.

The Audit Log pane includes logs for all activity related to the incident.
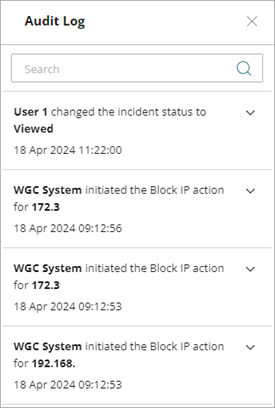
The Audit Log pane includes:
- Search — Enter text in the search box to filter the list results.
- Audit Log List — View the audit log list for the incident. Every action associated with the incident appears in the list. Select any item in the list to expand its details.
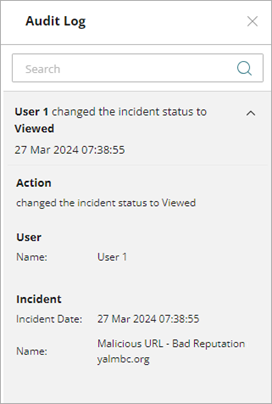
Details for a log entry can include:
- Action — A description of the event or action that triggered the audit log entry.
- User — The user who performed the event or action.
- Device — The type and ID of the device where the action was performed.
- Incident — The date and time of the event or action.
- Action Name — The name of the action performed.
Monitor Incidents in ThreatSync
Monitor Endpoints in ThreatSync