Applies To: WatchGuard Core MDR, WatchGuard Core MDR for Microsoft, WatchGuard Total MDR, WatchGuard Open MDR
For both Service Providers and Subscribers, the Managed Services portal Dashboard provides a quick overview of key metric data for the last 30 days. Several tiles show important information and provide links to more details.
The data you see depends on your WatchGuard MDR license. For more information, go to About WatchGuard MDR Licenses.
If no data shows in the Managed Services portal, the service is active but no detections have occurred. The portal shows data only after an event with potential security implications is detected. After you allocate users from the WatchGuard MDR license, it might take up to six hours for activity to show in the portal.
Service Provider Dashboard
The Service Provider dashboard shows aggregate data for your managed accounts. To view the data for one of your accounts, select the account from the drop-down list.
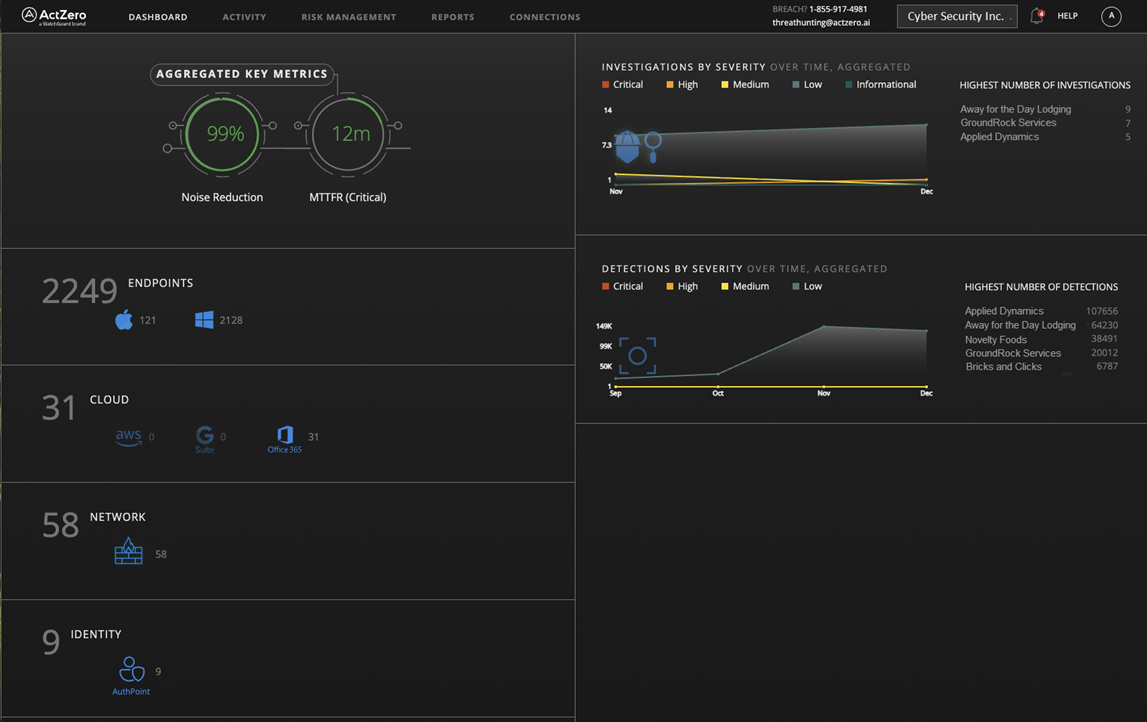
The Service Provider dashboard includes these tiles:
- Aggregated Key Metrics
- Endpoints
- Cloud
- Network
- Identity
- Investigations by Severity
- Detections by Severity
Aggregated Key Metrics
The Aggregated Key Metrics tile shows metrics across all of your managed accounts over the last 30 days.
Noise Reduction
Shows the percentage of detections that were filtered because they do not merit alerts. For example, some low severity detections are filtered because they are false positives.
MTTFR (Critical)
Shows the MTTFR (mean time to first response). This is the average time from the discovery of a critical severity detection and the time when WatchGuard MDR initiates a response. This is a global average across all WatchGuard MDR customers.
Endpoints
The Endpoints tile shows the number of active endpoints (computers and servers) across your managed accounts that send data to WatchGuard MDR. This might include data from WatchGuard Endpoint Security products, Microsoft Defender, and CrowdStrike EDR.
Cloud
The Cloud tile shows the number connected integrated cloud services across your managed accounts. Depending on your license and connected services, this might include Microsoft 365, AWS CloudTrail, and Google Workspace.
Network
The Network tile shows the total number of network devices across your managed accounts that are connected and have sent data. This includes data for WatchGuard Fireboxes, WatchGuard NDR sent from ThreatSync, and supported third-party firewalls.
Identity
The Identity tile shows the number of users across your managed accounts who authenticate with AuthPoint, Okta, and Duo.
Investigations by Severity
The Investigations by Severity tile shows instances where WatchGuard MDR or a security analyst detected potentially malicious activity and initiated an investigation for your managed accounts. Investigations contain contextual information and details that help you and WatchGuard MDR take action to protect your environment.
The tile also shows your top five managed accounts with the highest number of investigations.
To open the Investigations page and view the details, click the tile.
Detections by Severity
The Detections by Severity tile shows security detections across your managed accounts. Detections are events with potential security implications. WatchGuard MDR automatically blocks the source of detections or manually investigates detections, as needed.
The tile also shows your top five managed accounts with the highest number of detections.
To open the Detections page and view the details, click the tile.
Subscriber Dashboard
The Subscriber dashboard shows key metric data for the last 30 days.

The Subscriber dashboard includes these tiles:
The Vulnerabilities, Connections, and Controls tiles do not currently show any data.
Key Metrics
The Key Metrics tile shows metrics over the last 30 days.
Noise Reduction
Shows the percentage of detections for the environment that were filtered because they do not merit alerts. For example, some low severity detections are filtered because they are false positives.
MTTFR (Critical)
Shows the MTTFR (mean time to first response). This is the average time from the discovery of a critical severity detection and the time when WatchGuard MDR initiates a response. This is a global average across all WatchGuard MDR customers.
Investigations
The Investigations tile shows instances where WatchGuard MDR or a security analyst detected potentially malicious activity and initiated an investigation. Investigations contain contextual information and details that help you and WatchGuard MDR take action to protect your environment.
To open the Investigations page and view the details, click an investigation in the list.
Critical Emergent Threats
The Critical Emergent Threats tile contains links to top news stories and information about critical emergent cybersecurity threats.