Applies To: Locally-managed Fireboxes
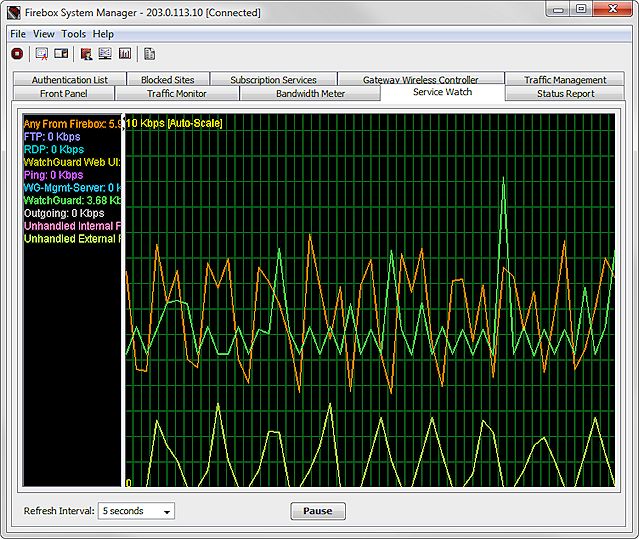
You can use Firebox System Manager to see a graph of the policies that are configured in Policy Manager for your Firebox. On the Service Watch tab, the Y axis (vertical) shows the number of connections, and the X axis (horizontal) shows the time. You can click any location on the chart to see more detailed information in a pop-up window about policy use at that point in time. You can also configure the appearance of the Service Watch tab.
Change Service Watch Settings
From Firebox System Manager, you can customize the appearance of Service Watch. You can select color settings for text and grid lines, select how the policy labels appear, and set the type and scale for charts.
To change the policy display settings, from Firebox System Manager:
- Select the Service Watch tab.
- Select File > Settings.
Or, right-click anywhere on the display and select Settings.
The Settings dialog box appears.
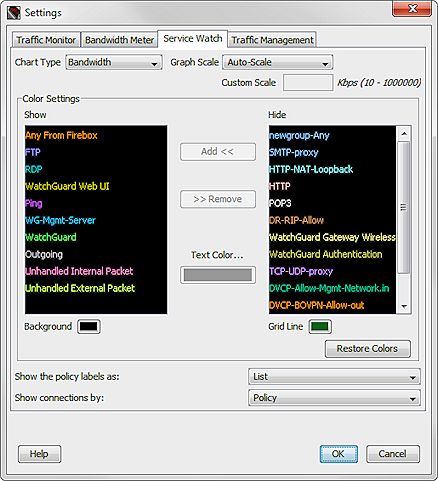
- From the Service Watch tab, you can customize the Service Watch display settings with the options in the next sections.
- When you are finished, click OK to save your changes and return to FSM.
Change the Scale
To change the scale of the Service Watch tab, from Firebox System Manager:
From the Graph Scale drop-down list, select the value that is the best match for the volume of traffic on your network.
To set a custom scale.
- From the Graph Scale drop-down list, select Custom Scale.
- In the Custom Scale text box, type the number of connections.
Display Bandwidth Used by a Policy
To see the amount of network capacity in bytes per second used by a policy instead of the number of connections:
From the Chart Type drop-down list, select Bandwidth.
To see bandwidth use by interface instead of policy, go to Visual Display of Bandwidth Usage (Bandwidth Meter).
Add and Remove Lines
To add a line to the Service Watch tab, from Firebox System Manager:
- In the Color Settings section, select the policy from the Hide list.
- To choose a color for the line, click the Text Color color control box and select a color.
- Click Add.
The policy name appears in the Show list in the color you selected.
To remove a line from the Service Watch tab, from Firebox System Manager:
- In the Color Settings section, select the policy from the Show list.
- Click Remove.
The policy name appears in the Hide list.
Change Colors
To change the display colors for the Service Watch tab, from Firebox System Manager:
- To choose new display colors, click the Background and Grid Line color control boxes to select new colors.
The Select Background Color or Select Grid Line color dialog box appears. - Select the Swatches, HSB, or RGB tab and choose a color.
An example of the selected color appears in the Preview section. - Click OK to confirm your selection and return to the Settings dialog box.
Change How Policy Names Appear
Policy names appear at the left side of the Service Watch tab. You can view policy names as a list or as a name tag adjacent to the line it identifies.
To set the appearance of the policy names, from Firebox System Manager:
From the Show the policy labels as drop-down list, select List or Tags.