Applies To: Locally-managed Fireboxes
On the Traffic Management tab in Firebox System Manager, you can see the bandwidth statistics for the traffic managed by traffic management actions configured on your Firebox. The statistics include details about which policies and applications use each traffic management action. The current bandwidth usage also appears and is shown as a percentage of the configured maximum bandwidth for the traffic management action. In the statistics, 1 Kbps is equal to 1024 bits per second.
When you first select the Traffic Management tab, statistical details do not appear until the Refresh Interval value expires. As Firebox System Manager receives the traffic management data, it appears on the Traffic Management chart and in the table below the chart.
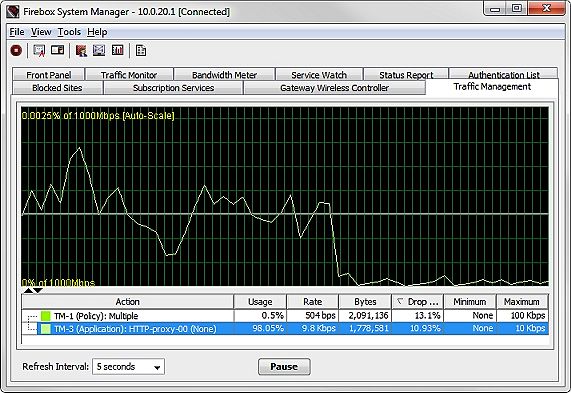
The table below the Traffic Management chart includes these statistics:
Action
The name of the traffic management action and the policies or Application Control actions to which the action is applied.
Usage
The amount of the maximum bandwidth that is currently in use. It is the Rate value divided by the Maximum value.
Rate
The current data rate for traffic managed by this action.
Bytes
The current number of bytes for traffic managed by this action.
Drop Rate
The historical drop rate of packets managed by this action. The Drop Rate statistic in the average percentage of packets dropped for all traffic managed by this action since it was created, last modified, or the device was rebooted.
To see the number of dropped packets and the total number of packets managed by this action, place your mouse over the Drop Rate.
Minimum
The minimum guaranteed bandwidth configured for this action.
Maximum
The maximum bandwidth configured for this action.
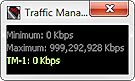
To see additional details for an interval in the chart:
Place your mouse over the interval and click the left button on your mouse.
A dialog box opens with details about the minimum and maximum bandwidth settings for that action and the actual rate used at that interval in the chart.
To see more information for any Traffic Management action that appears in the table:
From the table, select a Traffic Management action.
A dialog box opens with more information about that action.
The Traffic Management action information dialog box includes these details:
Direction
The traffic direction the action applies to:
- Forward — The action is configured in the policy as the Forward Action.
- Reverse — The action is configured in the policy as the Reverse Action.
- Both — The action is configured in the policy as both the Forward Action and the Reverse Action.
- None — The action is not configured as either the Forward Action or the Reverse Action, but is used in the Application Control action specified in the policy. For applications, the action applies to traffic in both directions.
Application Control Action Name
The name of the Application Control action specified in the policy, if the Application Control action uses the Traffic Management action. If there is not an Application Control action specified in the Traffic Management action, [No Application] appears after the policy name.
Below the Application Control Action Name, the list of applications the Traffic Management action applies to appears. If the action is used for an application category, [All Applications] appears for the application name, followed by the application category name. For applications, the action applies to application traffic in both directions.
Change Traffic Management Settings
From Firebox System Manager, you can customize the appearance of the Traffic Management tab. You can select color settings for text and grid lines, select how the interface labels appear, and set the scale for graphs.
To change the Traffic Management tab display settings:
- Select the Traffic Management tab.
- Select File > Settings.
Or, right-click anywhere on the display and select Settings.
The Settings dialog box opens with the Traffic Management tab selected.
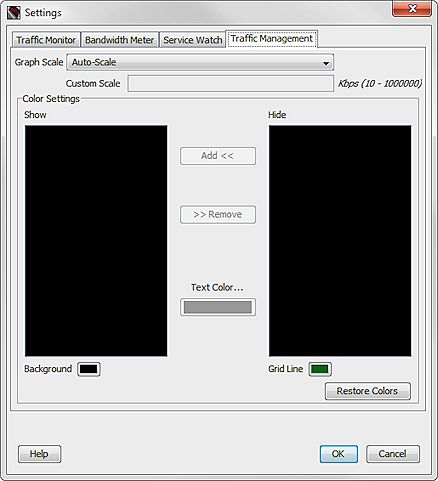
- Customize the display settings with the options described in the next sections.
- When you are finished, click OK to save your changes and return to FSM.
Change the Scale
From the Settings dialog box, you can change the scale for the display graphs, or you can right-click anywhere on the main FSM Traffic Management tab and select Graph Scale to set the scale.
To change the scale of the Traffic Management tab:
From the Graph Scale drop-down list, select the value that is the best match for the speed of your network.
To set a custom scale:
- From the Graph Scale drop-down list, select Custom Scale.
- In the Custom Scale text box, type the value in kilobytes per second.
Add and Remove Lines
To add a line to the Traffic Management tab:
- In the Color Settings section, select an interface from the Hide list.
- Click the Text Color color control box and select a color for the line.
- Click Add.
The interface name appears in the Show list in the color you selected.
To remove a line from the Traffic Management tab:
- In the Color Settings section, select an interface from the Show list.
- Click Remove.
The interface name appears in the Hide list.
Change Colors
To change the display colors for the Traffic Management tab:
- Click the Background and Grid Line color control boxes and select new colors.
The Select Background Color or Select Grid Line color dialog box opens. - Select the Swatches, HSB, or RGB tab and choose a color.
An example of the selected color appears in the Preview section. - Click OK to confirm your selection and return to the Settings dialog box.
To return to the default colors, click Restore Colors.