Applies To: Locally-managed Fireboxes
On the Firebox System Manager Front Panel tab, information about the Firebox traffic volume, processor load, and basic device status appears.
Below the Security Traffic Display are the Traffic volume indicator, processor Load indicator, and basic status information (Detail). The Traffic and Load indicators show the traffic volume and the Firebox capacity.
About the Traffic Meter
The Traffic meter includes eight indicators to show you the volume of traffic through your device. The amount of traffic that is required to trigger each indicator varies based on the device model.
To find the Firewall throughput value for your device:
- Go to the Product & Services page on the WatchGuard website at: https://www.watchguard.com/wgrd-products.
- Select a product line.
The product line page appears. - Select a device series.
The Overview page for the device series you selected appears. - Select the Detailed Specs tab.
The Detailed Specs page appears for your device series. - Find the Firewall throughput value in Mbps for your device model.
To light all indicators in the Traffic meter, the traffic on the device must exceed the maximum allowed throughput (in MBps) for that device model. To determine the maximum MBps, Firebox System Manager reviews the bytes sent through the device, which includes forwarded traffic as well as the host outbound traffic. Because the status counter shows the throughput in bytes, Firebox System Manager converts the bps (bits per second) values to Bps (bytes per second). The Bps necessary to light the first two indicators is the value of the next indicator divided by three. To light the next five indicators, divide the value of the next indicator by two.
To find the amount of throughput necessary to light each indicator, convert Mbps to MBps to find the maximum throughput in MBps for the device. Then use the Divisor information in this list to find the maximum MBps for each indicator.
| Indicator | Divisor | Maximum MBps |
|---|---|---|
| Red 2 (All) | (Maximum) | 20 MBps |
| Red 1 | Divide Red 2 by 2 | 10 MBps |
| Yellow 3 | Divide Red 1 by 2 | 5 MBps |
| Yellow 2 | Divide Yellow 3 by 2 | 2.5 MBps |
| Yellow 1 | Divide Yellow 2 by 2 | 1.25 MBps |
| Green 3 | Divide Yellow 1 by 2 | 625 KBps |
| Green 2 | Divide Green 3 by 3 | 208 KBps |
| Green 1 | Divide Green 2 by 3 | 69 KBps |
For example, if the maximum Mbps value for your device model is 160 Mbps, you convert the maximum throughput in Mbps to MBps, and complete the calculations described in this list to find the throughput in MBps required to light each indicator.
About the Load Meter
The Load meter includes eight indicators that show the Firebox capacity. Each indicator lights based on the percentage of CPU usage. The CPU utilization value from the device is the average percentage over the last minute. This list shows the CPU percentage usage level that is required to light each indicator.
| Indicator | CPU Percentage |
|---|---|
| Green 1 | 5% |
| Green 2 | 20% |
| Green 3 | 40% |
| Yellow 1 | 55% |
| Yellow 2 | 70% |
| Yellow 3 | 80% |
| Red 1 | 90% |
| Red 2 | 95% |
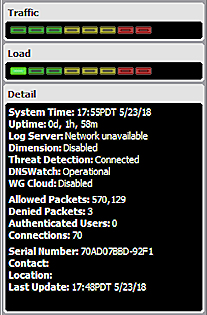
About the Detail Status
The Detail section shows basic information about the Firebox and the status of configured servers and services.
- The current system time set on the Firebox
- Firebox uptime since the last reboot
- Status of the connection to a Dimension or WSM Log Server
- Status of the connection to a Dimension server
- Status of cloud-based WatchGuard services:
- DNSWatch
- WatchGuard Cloud
- Packet and connection statistics
- Firebox system information (serial number, contact, and location)