Applies To: Locally-managed Fireboxes
On the Diagnostics pages, you can run diagnostic tasks and use diagnostic tools for the Dimension operating system, Dimension server, and email server.
- Select

 > Administration > Administration > System Settings.
The System Settings page opens. - Select Diagnostics.
The Diagnostics pages open. - Select a tab:
- Run the diagnostic tools, as described in the next sections.
Operating System Tasks
On the Operating System tab, you can run network and system tasks. You can also enable diagnostic access to Dimension for WatchGuard Support, update the Dimension system package, and review the Dimension Status Report.
Network Diagnostics
To monitor the health of your network, you can run these utilities:
- Ping
- Traceroute
- DNS lookup
To verify that Dimension can establish a connection to a specific IP address or host name, you can ping that IP address or host name from Dimension.
- From the Utility drop-down list, select Ping.
- In the IP Address or Host Name text box, type the IP address or host name to ping.
- Click Run.
The task runs and the results appear.
To trace the route from Dimension to an IP address, you can run the traceroute utility.
- From the Utility drop-down list, select Traceroute.
- From the Protocol drop-down list, select the protocol for the route: UDP or ICMP.
- In the IP Address or Host Name text box, type the IP address or host name to of the source or destination of the traffic.
- Click Run.
The task runs and the results appear.
To find the DNS information for an IP address, you can run the DNS lookup utility.
- From the Utility drop-down list, select DNS Lookup.
- From the Query Type drop-down list, select the query for the lookup: A, ANY, MX, NS, SOA, HINFO, TXT, SRV, AAAA, PTR.
- In the IP Address or Host Name text box, type the IP address or host name to ping.
- Click Run.
The task runs and the results appear.
System Diagnostics
From the System Diagnostics section, you can download a file with all the Dimension system diagnostic log messages, the Dimension database Status Report, and a support snapshot of the database. Whether you have the option to save or open the file depends on which web browser you use.
To download the diagnostics file:
- Click Download.
Dimension generates the support.tgz file. - Select whether to open or save the file support.tgz file.
You can also choose to send a file with the diagnostic information about your instance of Dimension to WatchGuard.
To send a diagnostic file to WatchGuard:
- Adjacent to Send diagnostic feedback about Dimension to WatchGuard, click Send.
A progress dialog box opens followed by a Diagnostics message dialog box. - To close the message dialog box, click OK.
Support Access for Diagnostics
Support Access is a secure method that WatchGuard Technical Support can use to get limited access to the operating system of your instance of WatchGuard Dimension.
If you contact WatchGuard Technical Support for assistance, your Technical Support representative could ask for Support Access to diagnose and troubleshoot problems with your Dimension system. Enable the Support Access for Diagnostics feature only when directed to do so by a WatchGuard Technical Support representative.
To connect to Dimension, a remote support representative must have a secure certificate and must be able to make an SSH connection to Dimension over the port you specify in the Support Access for Diagnostics settings. If your instance of Dimension is behind a gateway Firebox, you must also configure your gateway Firebox to allow access from WatchGuard Technical Support. Your support representative will provide instructions to correctly configure your gateway Firebox.
In the Support Access for Diagnostics section, you can enable or disable the Support Access feature and specify the port WatchGuard Technical Support can use to connect to your Dimension system.
- Click Configure.
The Support Access for Diagnostics dialog box opens. - Select the Enable Support Access check box.
- To use a port other than the default port (22), in the Port text box, type another port number.
- Click Save.
System Package Update
If your WatchGuard Support representative finds an issue with your Dimension system that can be resolved with an update to the Dimension system package, your representative might instruct you to update the system package to another version.
To update the system package, in the Update System Package section:
- Click Update.
- In the System Update text box, type the name of the system package to update.
- Click Update.
Status Report
The Status Report section shows statistics about Firebox traffic and performance.
To refresh the information in the Status Report section, click ![]() .
.
The Status Report includes this information:
Version information and uptime
The Dimension system software version, OS version, Dimension system UUID number, current UTC time, and system uptime.
Process list
Process ID, the name of the process, and the status of the process.
Memory and load average
Statistics on the memory use (shown in bytes of memory) and load average of Dimension. The load average has three values that typically show an average over the last minute, 5 minutes, and 15 minutes. Values over 1.00 (100%) indicate some threads are queued until resources are available. (A system load that exceeds 1.00 does not mean the system is overloaded.)
Disk Usage
The amount of space on the Dimension instance that is in use.
Mount Points
The mount point details for Dimension connections to a file system.
Interfaces
Each Dimension interface is included, with information about the interface type configuration (external, trusted, or optional), interface status, and packet count. For active trusted or optional interfaces, if IPv6 has been enabled for the interface, both the IPv4 and IPv6 address information is included.
Routes
The Routes section includes details for the Kernel IP routing table on Dimension.
ARP table
ARP table on Dimension. The ARP table is used to match IP addresses to hardware addresses.
DNS Servers
Address information for the DNS servers.
NTP
Address and status information for the NTP servers.
Dimension Server Tasks
On the Dimension Server tab, you can review the process information and log messages for the Dimension server, and the Dimension task history.
Process Information
The Process Information includes these details:
CPU
The percentage of the Dimension CPU cores that the Dimension server processes currently use.
Because each CPU core can run at 100%, if the server processes use both CPU cores, the maximum is 200%. To see the sum of the maximum amount of available bandwidth on the CPU cores that the web server processes can use, place your cursor over ![]() .
.
Memory
The amount of memory on the Dimension system that the process currently uses.
Uptime
The amount of time since the Dimension server was last restarted.
Task History
The Task History section includes all system tasks run by your Dimension Server in the last 30 days. Tasks older than 30 days are removed from the list.
The Task History list includes these details:
Status
The current status of the task:
- Active
- Complete
- Failed
Task Type
The type of system task, such as Upgrade Dimension.
Created
The date and time the task started.
Last Updated
The date and time information was last received about the task.
Additional Info
Information about the task, such as why a task failed, the process ID number for an active task, and the administrative user who completed the task.
When you reboot Dimension, any tasks with a Status of Active are stopped. After Dimension reboots, the Status for those tasks changes to Failed.
To see updated information in the Task History list, click ![]() .
.
Log Messages
In the Log Messages section, you can see the log messages generated by the Dimension web server.
To change the number of lines of log messages that appear in the Log Messages list:
- In the Number of log messages to show text box, type the number of lines from the log file to show.
- Click
 .
.
The Log Messages list is updated with the latest log messages and only shows the number of lines you specified.
From the Email tab, you can verify the status of the email system, run diagnostic tasks for the email system, and review log messages from the email server.
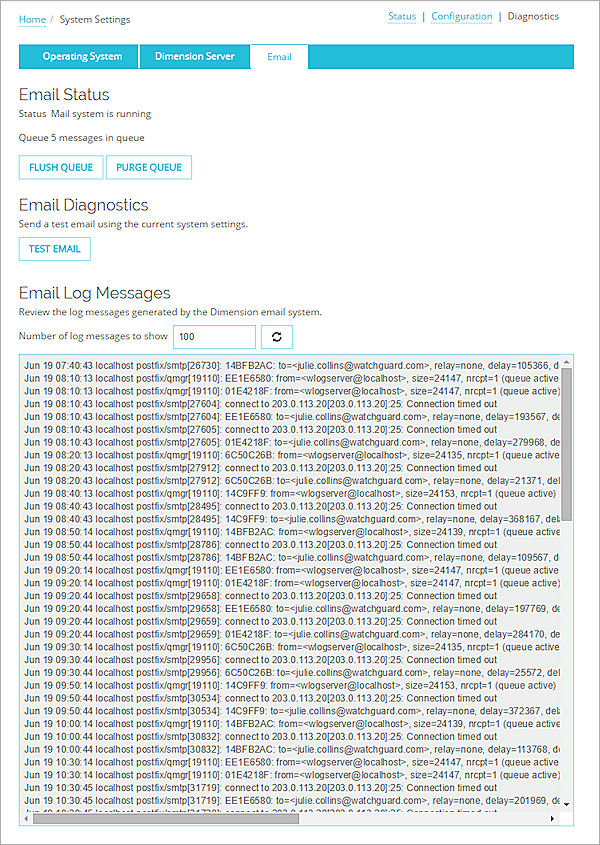
Review the Status of the Email Server
In the Email Status section, you can see the current status of the email server and how many email notification messages from Dimension are in the email queue.
Normally, the Dimension email server sends messages as soon as they are generated. If there is a problem with the email server that causes the messages not to send, the messages are added to the email queue. When this occurs, the Dimension administrator can either wait for the email server to be available again and then send all the messages in the queue, or remove all the messages from the queue.
To send all messages that are in the email queue, click Flush Queue.
The Dimension email server attempts to send the messages again.
To remove all messages from the queue, click Purge Queue.
The Dimension email server removes all messages from the queue, and the Queue status changes to Empty.
Run Email Server Diagnostics
To verify that the mail server is available to send notification email messages when they are generated, you can run a diagnostic test of the email server.
To run email diagnostics:
- Click Test Email.
The Send test email dialog box opens.
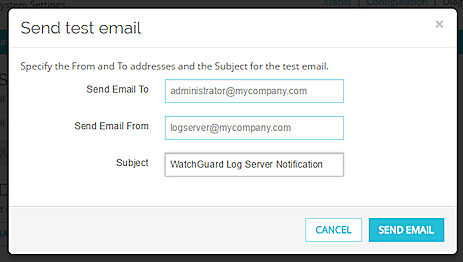
- In the Send Email To text box, type the destination address of the test email message.
This is typically the Dimension Administrator. - In the Send Email From text box, type the source address of the test email message.
This is typically the address of the email server - In the Subject text box, type the subject line for the email message.
- Click Send Email.
The email server sends the test email and Message Sent appears adjacent to Test Email.
Review Email Server Log Messages
In the Email Log Messages section, the log messages that are generated by the Dimension email server appear. You can review these log messages to see the events that have occurred on the Dimension email server.
To change the number of log messages that appear in the list:
- In the Number of log messages to show text box, type the number of log messages to include in the list.
- Click .
The list updates to show the number of log messages you specified.
To refresh the list of log messages, click ![]() .
.
Configure and Monitor the Dimension Database