Device Summary
To review the Device Summary for a Firebox or FireCluster with a management connection to Dimension:
- Select Home > Devices.
The Devices page opens. - From the Devices list, select a managed Firebox or FireCluster.
The Device Summary page opens .
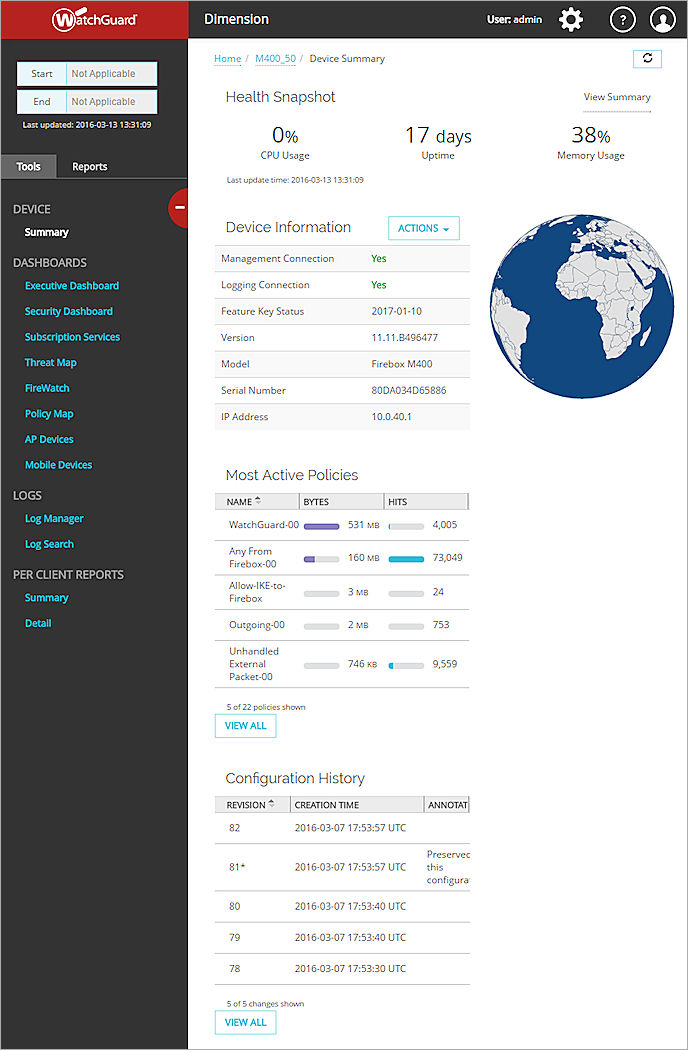
Example of the Device Summary page for a single Firebox with a management connection to Dimension.
- Review the summary information and complete the actions described in the next sections.
To review the Device Summary for a Firebox or FireCluster with only a logging connection to Dimension:
- Select Home > Devices.
The Devices page opens. - From the Devices list, select a Firebox or FireCluster with only a logging connection.
The Executive Summary page opens . - From the Tools list, select Device Summary.
- Review the summary information as described in the next sections.
Health Snapshot
The Health Snapshot section includes current information about your Firebox and a summary of the Firebox health status. The amount of time since the Firebox was last updated appears at the bottom of this section.
CPU Usage
This is the average CPU usage for the Firebox since the last time the Firebox was updated.
Uptime
This is the amount of time that has passed since the Firebox was last rebooted.
Memory Usage
This is the average amount of memory usage since the last time the Firebox was updated.
View Summary
To see the Health Summary report with more information about the snapshot information included in the Health Snapshot section, click the View Summary link.
The Health Summary report includes the minimum, average, and maximum Memory and CPU usage for the Firebox. It also includes details about the physical interfaces in use on the Firebox, an option to pivot on the interface details by data sent or received through the interfaces, and an option to see the data as a chart.
You can download the Health Summary report as a PDF file.
You can also review the Health Summary report from the Reports page in Dimension. For more information about the Health Summary report, go to About Dimension Reports.
Device Information
The Device Information section includes details about your Firebox. If your Firebox is managed by Dimension, the Actions drop-down list also appears in this section, to enable you to quickly open the Fireware Web UI for the Firebox, reboot the Firebox, or update the feature key on the Firebox.
Management Connection
The status of the management connection between the Firebox and Dimension:
- Yes — The Firebox is currently connected to Dimension for management.
- No — The Firebox has been enabled to connect to Dimension for management, but is not connected.
- Disabled — The Firebox has not been enabled to connect to Dimension for management.
- Backup — The Firebox is the backup master for a FireCluster.
Logging Connection
The status of the logging connection between the Firebox and Dimension:
- Yes — The Firebox is currently connected to Dimension and can send log messages.
- No — The Firebox has been enabled to send log messages to Dimension, but is not connected.
- Disabled — The Firebox has not been enabled to send log messages to Dimension.
- Backup — The Firebox is the backup master for a FireCluster.
Feature Key
If all the licensed features included in the feature key for the Firebox do not have the same expiration date, this is the date of the licensed feature that is the next to expire. If all the licensed features have the same expiration date, this is the date that all the licensed features on your Firebox will expire.
Version
The Fireware OS version on the Firebox, and the build number of the OS version.
Model
The model name and number of the Firebox.
Serial Number
The serial number of the Firebox.
IP Address
The IP address the Firebox uses to connect to Dimension.
Actions
If your Firebox is managed by Dimension, the Actions drop-down list appears.
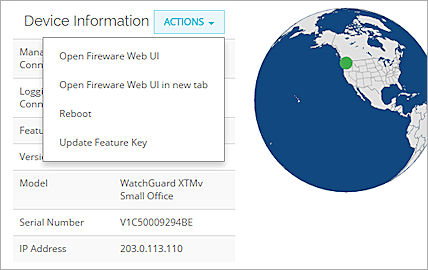
You can select these actions:
- Open Fireware Web UI
- Open Fireware Web UI in new tab
- Reboot
- Update Feature Key
For more information about how to open Fireware Web UI from Dimension, go to Manage a Firebox.
World Map
The world map shows the approximate physical location of the Firebox on the globe. The Firebox location is based on geolocation of the Firebox. If the location cannot be determined by geolocation, the longitude and latitude you specified for the Firebox when you added it to Dimension are used to locate the Firebox on the map.
Most Active Policies
For Fireboxes managed by Dimension, the Most Active Policies section appears on the Device Summary page.
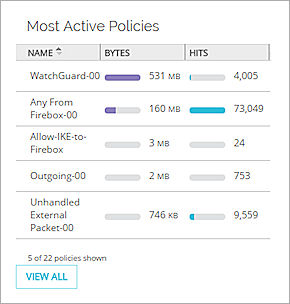
This section includes the top five most used policies on the Firebox, based on the latest Health Summary information. If there are no active policies for the current date and time range, the Most Active Policies section does not appear.
For each policy, these details appear:
Name
The name of the policy as defined in the Firebox device configuration file.
Bytes
The amount of traffic in bytes through the policy.
Hits
The number of traffic hits through the policy.
You can also open the Policy Usage report for the Firebox to see all the policies included in the Firebox configuration and the details for each policy. In addition to the name, bytes, and hits, the Policy Usage report also includes the current status of the policy. This includes whether the policy is in use, when the policy was last used, and if the policy was deleted. Policies that have been deleted show when the policy was last used before it was deleted. You can review the information in this report to help you manage your configuration for PCI compliance.
For more information about PCI compliance, go to About PCI Compliance Reports.
To view the Policy Usage report:
From the Most Active Policies section, click View All.
The Policy Usage report appears.

Configuration History
If your Firebox is managed by Dimension, the Device Summary page includes the Configuration History section. This section does not appear for Fireboxes with only a logging connection to Dimension.
The Configuration History section includes a list of the revisions to the Firebox device configuration file that you have made since the Firebox was added to Dimension for management, with the date and time of each revision. By default, the Configuration History list shows the last five revisions. You can change the number of device configuration file revisions that Dimension stores in the configuration history. For more information, go to Configure Settings for Managed Devices.
You can also view the full list of revisions available for the Firebox, revert to a revision in the list, or compare two revisions to find the differences between them.
For more information about how to view all revisions, revert to a revision, or run a diff on two revisions, go to Manage Device Configuration History.