Use VPN Diagnostic Messages
When a branch office VPN tunnel connection fails, you can use VPN diagnostic messages to learn more about what failed and determine the next step to take to resolve the problem. To see the most complete and useful diagnostic messages, look at the message on one endpoint after the remote gateway endpoint attempts to initiate the VPN negotiation. For more information, go to Monitor and Troubleshoot BOVPN Tunnels.
There are several places you can see VPN diagnostic messages:
- Fireware Web UI, System Status > VPN Statistics page
- Firebox System Manager, Front Panel tab
- WatchGuard System Manager, Device Status tab
VPN diagnostic messages for a tunnel include the tunnel name, and indicate a problem with tunnel route or Phase 2 settings. VPN diagnostic messages related to a VPN gateway refer to the gateway endpoint by number. For example, if a gateway has two gateway endpoint pairs, VPN diagnostic messages refer to the first gateway endpoint as Endpoint 1, and the second as Endpoint 2. VPN diagnostic messages can be errors or warnings.
Errors
VPN diagnostic errors indicate the VPN failed because of a configuration or connection issue. In Fireware Web UI, a red Error status indicates that a gateway or tunnel has a diagnostic error. In Firebox System Manager and WatchGuard System Manager, errors have red text.
Warnings
VPN diagnostic warnings indicate a that a VPN is down because of an abnormal condition, such as dead peer detection (DPD) failure. In Fireware Web UI, an orange Warning status indicates that a gateway or tunnel has a diagnostic warning. In Firebox System Manager and WatchGuard System Manager, warnings have orange text.
If a tunnel is inactive, it can be helpful to rekey the tunnel to force VPN negotiations to restart. For more information, go to Force a Branch Office VPN Tunnel Rekey.
VPN Diagnostics in the Web UI
From Fireware Web UI, you can see VPN diagnostic messages, run the VPN Diagnostic Report, and edit the VPN configuration.
To see VPN diagnostic messages, from Fireware Web UI:
- Select System Status > VPN Statistics.
Gateways that have a VPN diagnostic message are marked with an Error or Warning status. - Click a gateway name to expand it.
The VPN diagnostic messages for the gateway and all tunnels appear below the gateway. Diagnostic messages for a tunnel also appear below the tunnel.
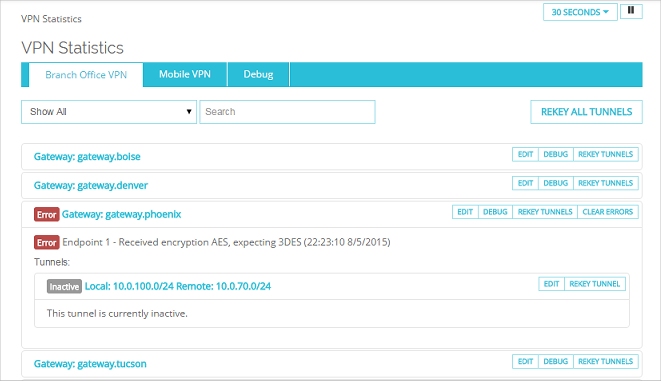
- Click a tunnel below the gateway to expand the status for the tunnel.
After you see a VPN diagnostic message on the VPN Statistics page, you can take any of these actions to troubleshoot the problem:
- To generate the VPN Diagnostic Report, adjacent to the gateway, click Debug.
For more information, go to Use the VPN Diagnostic Report. - To edit the gateway configuration, adjacent to the gateway, click Edit.
For more information, go to Configure Manual BOVPN Gateways. - To edit the tunnel configuration, adjacent to the tunnel, click Edit. Or, in the diagnostic error message, click the tunnel name.
For more information, go to Define a Tunnel.
VPN Diagnostics in WatchGuard System Manager and Firebox System Manager
From WatchGuard System Manager and Firebox System Manager, you can see the VPN diagnostic messages and run the VPN Diagnostic Report.
To see VPN diagnostic messages, from Firebox System Manager:
- Select the Front Panel tab.
- Expand the Branch Office VPN Tunnels tree.
A list of gateways appears. A gateway that has a diagnostic error is marked with a yellow triangle. - Expand the gateway.
A list of tunnels for that gateway, and any VPN diagnostic messages appear.
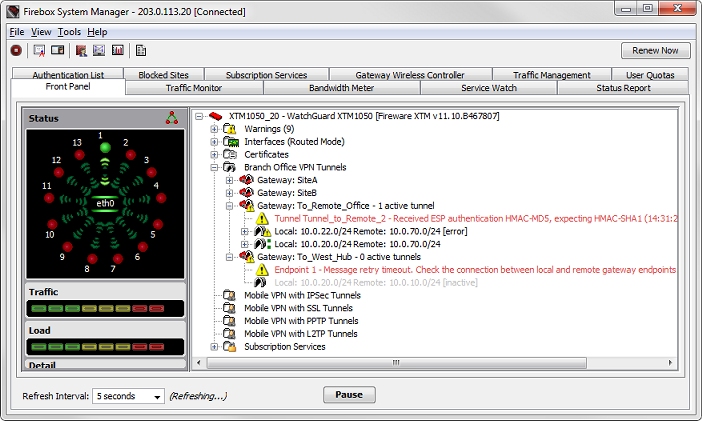
- Expand a tunnel below the gateway to see the status for the tunnel.
- To run the VPN Diagnostic report to see more about an error, right-click the gateway, and select VPN Diagnostic Report.
The Diagnostic Tasks dialog box appears, and the VPN Diagnostic Report is automatically generated.
For more information about the VPN Diagnostic Report, go to Use the VPN Diagnostic Report.
To see VPN diagnostic messages, from WatchGuard System Manager:
- On the Device Status tab, expand the device tree to see the status items.
- Expand the Branch Office VPN Tunnels tree.
A list of gateways appears. - Expand the gateway.
A list of tunnels for that gateway and any VPN diagnostic messages appear.
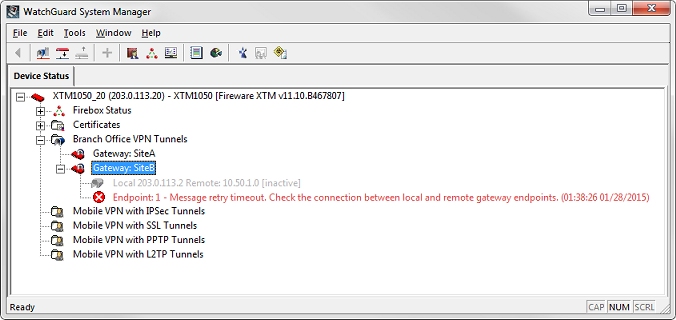
- Expand a tunnel in the gateway tree to see the status for the tunnel.
If a VPN diagnostic message appears in WatchGuard System Manager, for more information about the diagnostic message, use Firebox System Manager or Fireware Web UI to run the VPN Diagnostic Report, as described in the previous sections.