Applies To: Endpoint Security Elite, Endpoint Security 360, Endpoint Security Prime, WatchGuard EDR, WatchGuard EDR Core, Endpoint Security Basic
ProcDump is a Windows command-line utility that you can use to monitor a process and create a dump file. You can use ProcDump to trigger the creation of a dump file when specific requirements are met, such as a CPU spike on the computer.
When you create a process dump file from a Microsoft Windows computer, the file contains information about the available physical memory the process uses. The file also contains a record of the state of all available computer memory and what occurred in that memory at the time you created the dump file.
For information about how to create PSANHost dump files when the PSANHost process crashes, go to Troubleshoot PSANHost Crash Dump Files.
Disable Anti-Tamper Protection
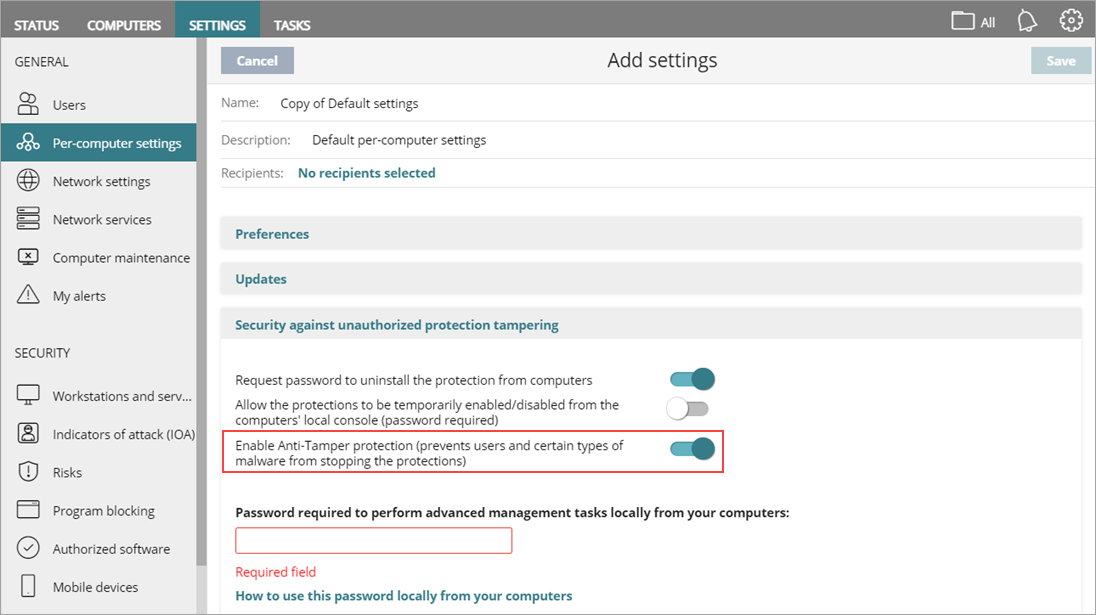
Anti-tamper protection makes sure that only authorized users can install, disable, or uninstall WatchGuard Endpoint Security. If you enable anti-tamper protection, the configured password is required to disable anti-tamper protection locally from the protected computer.
Before you create a dump file, you must disable WatchGuard Endpoint Security anti-tamper protection for the endpoint computer. You must also restart the endpoint computer that you want to create the dump file for.
Your operator role determines what you can see and do in WatchGuard Cloud. Your role must have the Configure Per-Computer Settings permission to view or configure this feature. For more information, go to Manage WatchGuard Cloud Operators and Roles.
To disable anti-tamper protection:
- In WatchGuard Cloud, select Configure > Endpoint Security.
- Select Settings.
- From the left pane, select Per-Computer Settings.
- Copy an existing settings profile and use it to create a new per-computer settings profile. For more information, go to Configure Per-Computer Settings.
- Assign the profile to the endpoint computer where you want to create a dump file.
- From the new per-computer settings profile, disable the Enable Anti-Tamper protection toggle.
- Click Save.
- To unlock any anti-tamper protection processes, restart the endpoint computer.
Collect a Process Dump File
There are multiple methods to collect a process dump file. Use the instructions that most fit your use case:
- Collect a Process Dump File for Constant High CPU Usage
- Collect a Process Dump File When a Process Crashes
- Collect a Process Dump File On Demand
Collect a Process Dump File for Constant High CPU Usage
You can use ProcDump to monitor a process and trigger the creation of a dump file when ProcDump detects high CPU usage on the endpoint computer.
Before you complete these steps, you must Disable Anti-Tamper Protection.
To monitor high CPU usage and create a dump file:
- Download ProcDump.exe from the Microsoft website:
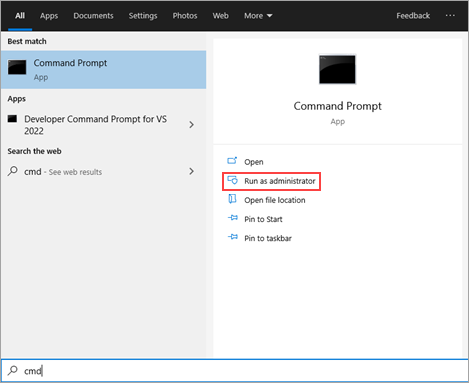
https://learn.microsoft.com/en-en/sysinternals/downloads/procdump - From the endpoint computer that you want to create a dump file for, open a Command Prompt window as an administrator.
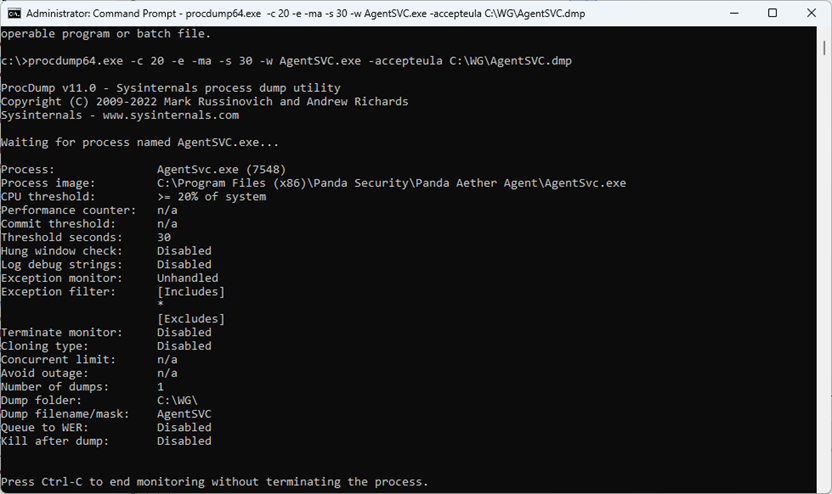
- Run ProcDump with these parameters:
procdump.exe -c <CPUTHRESHOLD> -e -ma -s 30 -w <ProcessName>.exe -accepteula <YourLocation>\<ProcessName>.dmp
This example creates a dump file for the AgentSVC.exe process when CPU usage exceeds 20% for 30 consecutive seconds:
procdump.exe -c 20 -e -ma -s 30 -w AgentSVC.exe -accepteula C:\WG\AgentSVC.dmp
Make sure that the location you specify to save the dump file to exists on the computer.
- Keep the Command Prompt window open and run the ProcDump application until the issue reproduces.
You do not have to press Ctrl+C on your keyboard to stop monitoring. The process dump file saves to the computer automatically.
- Create a .ZIP archive of the contents of the folder and send the archive to Support.
Collect a Process Dump File When a Process Crashes
You can use ProcDump when a process crashes on an endpoint computer.
Before you complete these steps, you must Disable Anti-Tamper Protection.
To create a dump file when a process crashes:
- From the endpoint computer that you want to create a dump file for, open a Command Prompt window as an administrator.
- Run ProcDump with these parameters:
procdump.exe -e -ma -w <ProcessName> -accepteula <YourLocation>\<ProcessName>.dmp
This example collects a dump file for AgentSVC.exe process when the application crashes:
procdump.exe -e -ma -w AgentSVC.exe -accepteula C:\WG\AgentSVC.dmp
Make sure that the location you specify to save the dump file to exists on the computer.
- Keep the Command Prompt window open and run the ProcDump application until the issue reproduces.
You do not have to press Ctrl+C on your keyboard to end monitoring. The process dump file saves to the computer automatically.
- Create a .ZIP archive of the contents of the folder, and send the archive to Support.
Collect a Process Dump File On Demand
If you want to create a dump file on demand, you can create a dump file from Microsoft Windows on the endpoint computer after an issue occurs.
Before you complete these steps, you must Disable Anti-Tamper Protection.
To create a dump file, from Microsoft Windows on the endpoint computer:
- Wait until the issue reproduces.
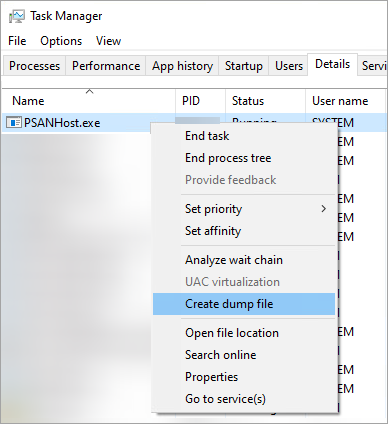
- To open Task Manager, press Ctrl+Alt+Delete.
- From the Details tab, right-click the target process you want to create a dump file for.
- Select Create Dump File.
- Click Open File Location to browse to the dump file.
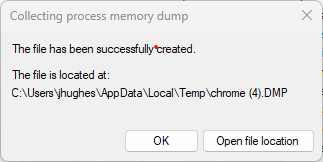
- Create a .ZIP archive of the contents of the folder and send the archive to Support.
Troubleshoot ProcDump Errors
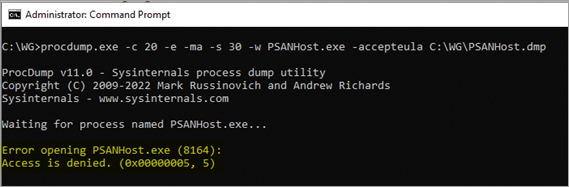
If you experience an error when you use ProcDump, the process might be protected by anti-tamper protection.
This is an example of an error:
Error opening PSANHost.exe (8164):
Access is denied. (0x00000005, 5)
If you experience an error, make sure that you disable anti-tamper protection in WatchGuard Endpoint Security for the endpoint computer and then restart the computer.