Applies To: WatchGuard Advanced Reporting Tool and Data Control
You can use queries to search the data collected in the Advanced Visualization Tool. No programming knowledge is required to create a query, but if you are familiar with SQL, you can use scripting in the Search window.
The search toolbar above the data table includes the primary tools used to create a query from a data table:

![]() Aggregate
Aggregate
Aggregations are operations that you can perform on table data that has already been grouped by a time interval.
Aggregate functions perform a calculation on a set of values and return a single value. Operations can count records in a group, identify the minimum or maximum value in a group, or calculate the sum of field values in a group. When you create an aggregation, a new column appears in the table and shows the results of the operation.
For more information, go to the latest information from Devo docs (external link).
![]() Group
Group
You can group events in a data table to facilitate analysis. The result of grouping is a data table that presents all the different row value combinations of the grouped columns. Grouping is also required to subsequently apply aggregation operations to the data.
For more information, go to the latest information from Devo docs (external link).
![]() Filter OR
Filter OR
You can filter data with the OR selector, which enables you to include specific values from one or several columns to define a filter that returns events that meet x OR y conditions.
For more information, go to the latest information from Devo docs (external link).
![]() Filter
Filter
Apply filters to table data to isolate or exclude specified field values. Results return immediately and appear in chronological order. The Advanced Visualization Tool updates the timeline to match the query.
For more information, go to the latest information from Devo docs (external link).
![]() Add Column
Add Column
You can create new columns in your data tables, based on other data that is already present. For example, apply a geolocation operation to an existing IP address column to create a new column that identifies the country.
For more information, go to the latest information from Devo docs (external link).
To create a search query, in the Advanced Visualization Tool:
- From the left pane, select Data Search.
- Select the data table you want to see.
For more information, go to About Data Tables. - In the search window, use the tools in the toolbar to make changes to the data table.
You must group your data before you perform an aggregation operation.
Edit Queries in SQL
As an alternative to the tools in the search window, you can edit a query directly.
To open the query editor, in the search toolbar, click ![]() .
.
For more information on how to edit a query, go to Sample SQL Query Text.
You can also edit an existing query from the Advanced Reporting or Data Control dashboards. Each tile in a dashboard shows data based on a specific query. You can modify the query to customize the data table.
To edit an existing dashboard query, in the Advanced Visualization Tool:
- From the left pane, select Advanced Reporting or Data Control, and select the dashboard you want to see.
- In the tile you want to open the data table and query for, click
 .
.
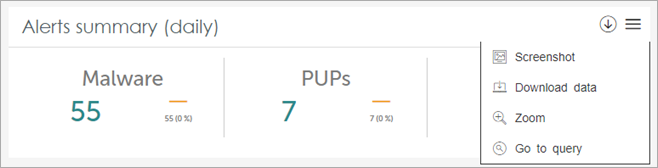
- Select Go to Query.
The data table opens in the search window.
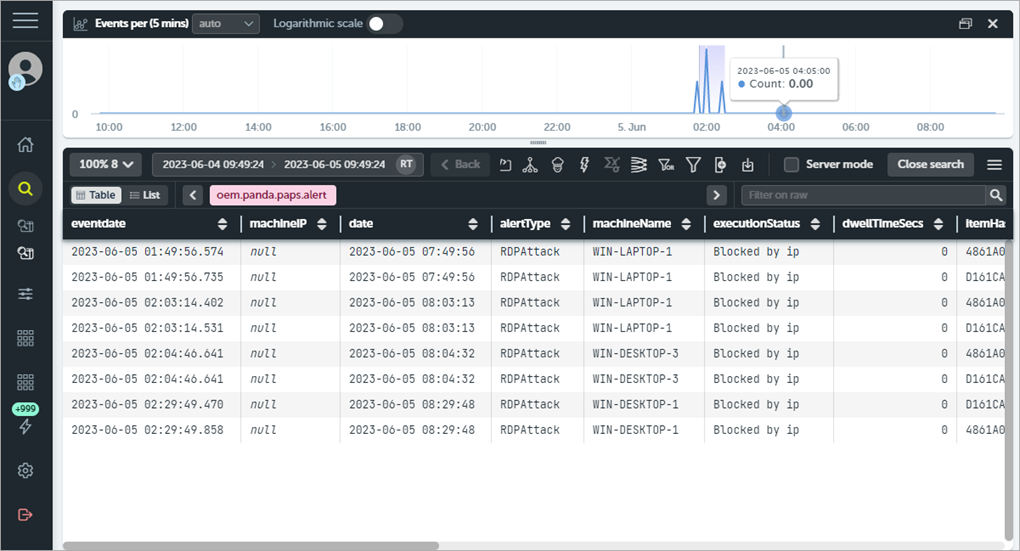
- Make changes to the data table, as required.
- To open the query code editor and edit the SQL query directly, click
 .
.
The edited query for the data table shows in the left pane, below Data Search.