Applies To: WatchGuard CloudDR
The Dashboard page in WatchGuard CloudDR provides a centralized, overview of an organization’s cloud application security posture. The dashboard aggregates key metrics across managed applications, discovered applications, identities, and shared data. The data on the dashboard reflects the organization or organizations selected.
For a single organization, you can also view, download, and schedule reports from the dashboard. For more information, go to Reports.
For information on organizations in CloudDR, go to About Organizations in WatchGuard CloudDR.
To open the dashboard page, from WatchGuard Cloud:
- Select Monitor > CloudDR.
- Select Dashboard.
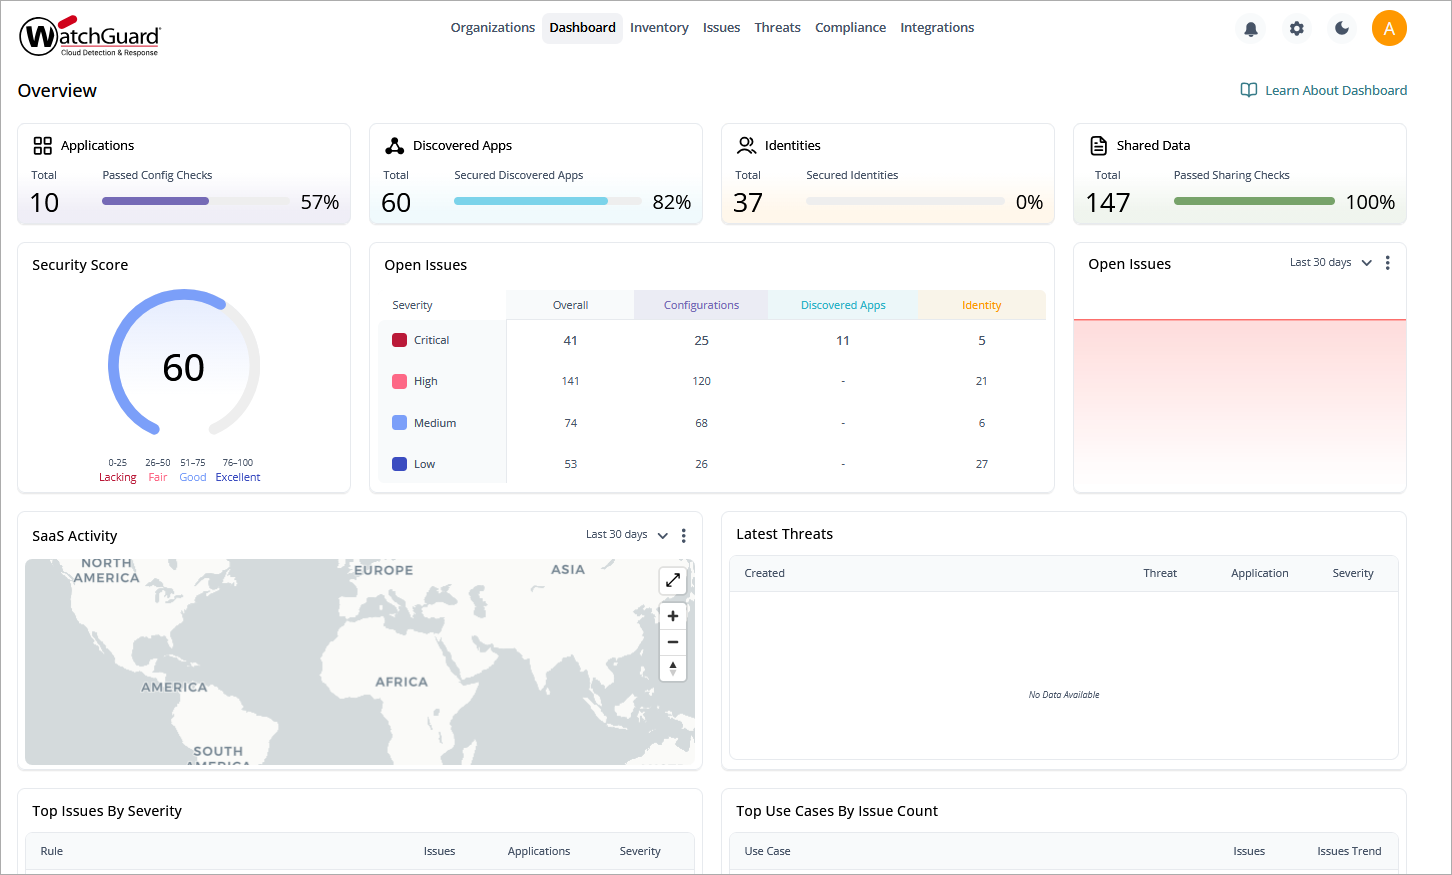
Dashboard Widgets
Use the dashboard widgets as a starting point to assess risk, spot problem areas, and navigate to more detailed views for investigation and remediation.
These widgets are available on the Dashboard page:
Applications
Shows the total number of applications integrated and the percentage of secure configurations out of all the misconfigurations supported for the integrated applications.
Discovered Apps
Shows the total number of applications discovered from integrations and the percentage of discovered applications that are secured.
Identities
Shows the total number of user accounts identified from integrations and the percentage of identities that are secured.
Shared Data
Shows the total number of shared data checks performed from integrations and the percentage of checks that are passed.
Security Score
Shows the average of the percentage of other checks passed.
Open Issues
Shows a breakdown of the open issues, sorted by severity, in each category. To view more issues, click ![]() , and select Show More.
, and select Show More.
Open Issues Graph
Shows a visual view of the number of open issues over time period that can be filtered from the last 7 days, 30 days, 90 days, or lifetime. To view more issues, click ![]() , and select Show More.
, and select Show More.
SaaS Activity
Shows threat activity geographically. You can filter the activity you want to show by date (Last 90 days, Last 30 days, and Last 7 days).
Latest Threats
Shows a list of the most recent threats, including the application and severity. To view more threats, click ![]() , and select Show More. Click a row to view detailed information for a specific threat.
, and select Show More. Click a row to view detailed information for a specific threat.
Top Issues By Severity
Shows a list of the highest issue count use cases in descending order. To view more issues, click ![]() , and select Show More. Click a row to view detailed information for a specific issue.
, and select Show More. Click a row to view detailed information for a specific issue.
Top Use Cases By Issue Count
Shows a list of the highest issue count use cases in descending order. To view more use cases, click ![]() , and select Show More. Click a row to view detailed information for a specific use case.
, and select Show More. Click a row to view detailed information for a specific use case.
Most Used Applications
Shows a list of integrated applications that have the largest number of users, as well as the overall severity of the issues found for these applications. To view more applications, click ![]() , and select Show More. Click a row to view detailed information for a specific application.
, and select Show More. Click a row to view detailed information for a specific application.
Most Used Discovered Applications
Shows a list of the discovered applications that have the largest number of users. To view more discovered applications, click ![]() , and select Show More. Click a row to view detailed information for a discovered application.
, and select Show More. Click a row to view detailed information for a discovered application.
Posture by Risk
Shows a list of risks with the number of issues and overall posture. To view more risks, click ![]() , and select Show More. Click a row to view detailed information for a specific risk.
, and select Show More. Click a row to view detailed information for a specific risk.
Posture by Compliance Framework
Shows a list of the compliance frameworks you follow with the lowest security posture. To view more frameworks, click ![]() , and select Show More. Click a row to view detailed information for a specific framework.
, and select Show More. Click a row to view detailed information for a specific framework.
Reports
On the Dashboard > Reports page for an individual organization, you can view these reports:
Security Overview Report
This report provides a concise summary of your organization’s cloud security posture across applications, identities, and data. It gives all users a clear view of security issues, trends, and changes in the cloud environment over time.
The report highlights key findings such as misconfigurations, risky account activity, shadow applications, and exposed data. It also includes metrics such as security scores, issue counts, and risk severity to help you understand overall risk and identify priority areas for remediation.
Use the insights in this report to take proactive steps to reduce risk, address vulnerabilities, and improve your organization’s cloud security posture.
Discovered Applications Report
This report provides a concise summary of shadow and discovered applications in your cloud environment. It gives all users clear visibility into unauthorized or unmanaged applications, highlighting trends, risks, and changes over time.
The report highlights key findings such as shadow application usage, risky permission scopes, AI‑based applications, and vendor risk levels. It also includes metrics such as application counts, security scores, and identified issues to help you understand the scope and impact of unmanaged application access.
Detailed sections identify the most active or highest‑risk applications and show how granted permissions and usage patterns can introduce security risks such as data exposure or unauthorized access.
Use the insights in this report to identify unapproved applications, reduce risky access, and strengthen governance across your cloud environment.
Compliance Overview Report
This report provides a concise summary of your organization’s compliance posture across cloud applications and supported frameworks. It gives all users a clear view of compliance status, gaps, and changes over time to help track alignment with security standards.
The report highlights key findings such as overall compliance scores, passed and failed controls, and coverage across selected frameworks. It also includes application‑level insights to show how individual cloud services contribute to compliance risk.
Detailed sections identify control gaps across categories such as asset management, data protection, access control, and monitoring, along with examples of high‑impact misconfigurations that can affect compliance and increase risk.
Use the insights in this report to address compliance gaps, strengthen control coverage, and improve your organization’s overall cloud compliance posture.
Single Compliance Report
This report provides a concise summary of your organization’s compliance posture across cloud applications and a single compliance framework. Select the compliance that you want to generate the report for. This report is not available for download.
To view a report, for an organization:
- Open the Dashboard > Reports page.
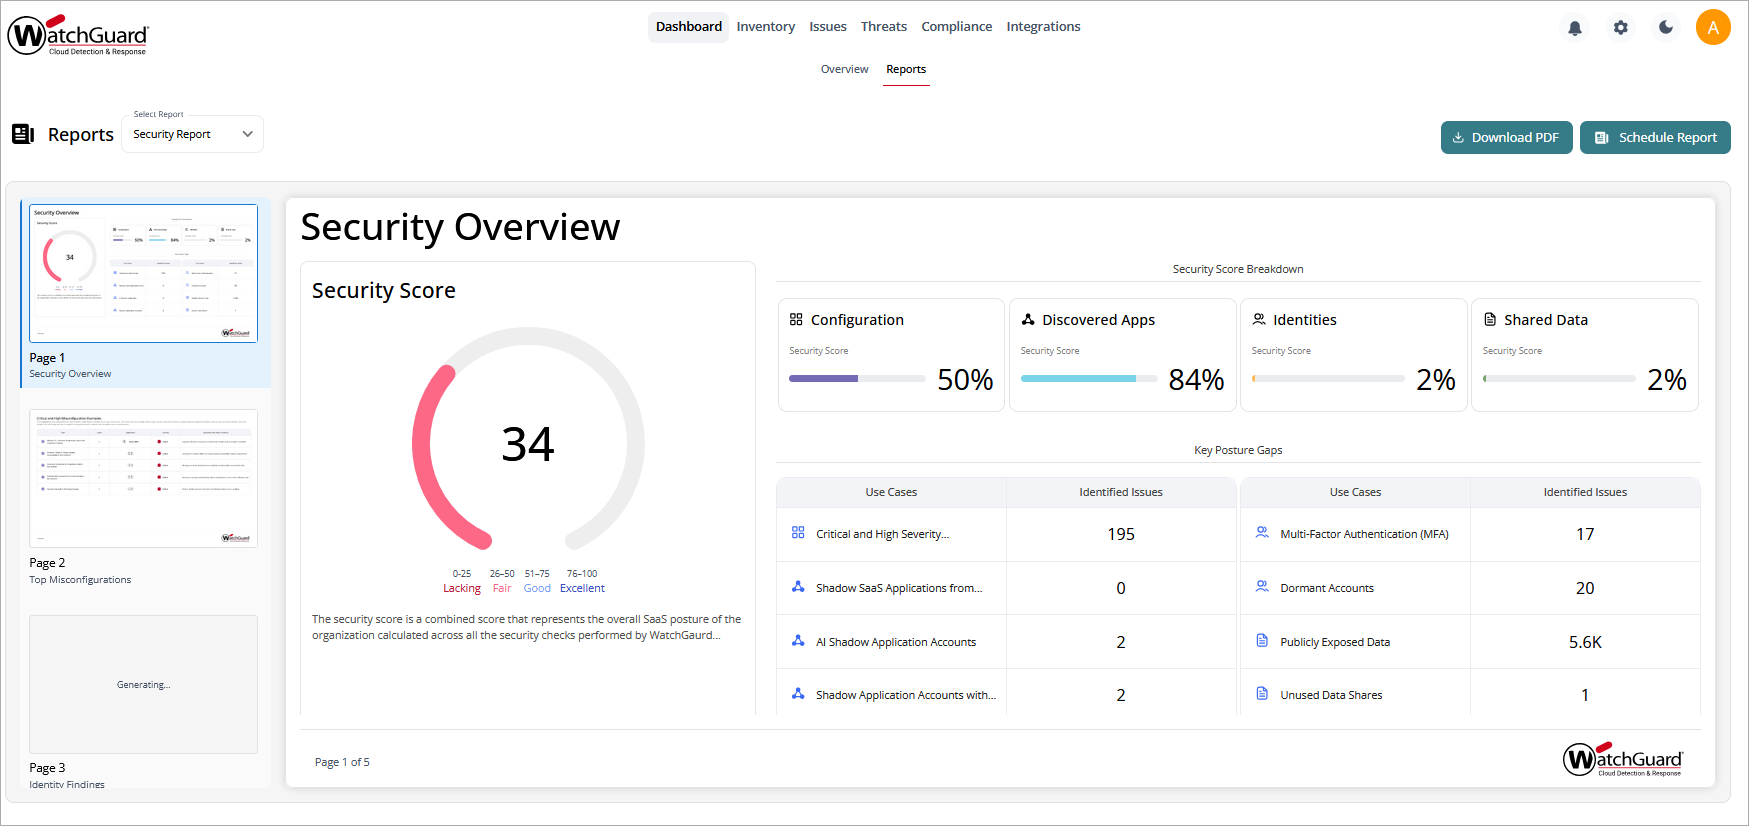
- From the Select Report drop-down list, select the report you want to view.
- From the left panel, click the page to view the page content.
- To download a PDF of the report, click Download PDF in the upper-right corner.
Schedule a Report
You can schedule a report to be sent by email at a specific date and time.
To schedule the report for a selected organization:
- On the Dashboard > Reports page, from the Select Report drop-down list, select the report you want to view.
- Click Schedule Report in the upper-right corner.
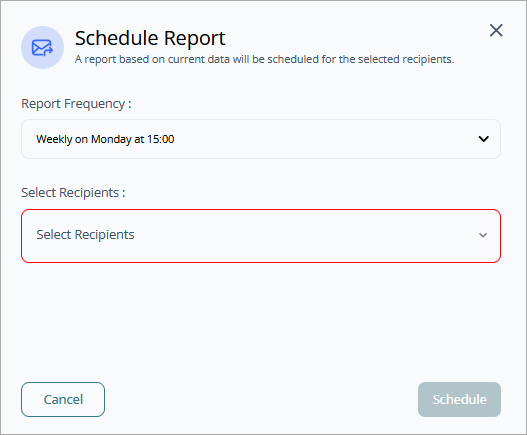
- Select the report frequency.
- Enter the email address of the report recipients.
- Click Schedule.