Applies To: Cloud-managed Fireboxes, Locally-managed Fireboxes
The SD-WAN report shows loss, latency, and jitter for all monitored interfaces over time.
- Loss — Percentage of packets lost
- Latency — Packet delivery delay, measured in milliseconds (ms)
- Jitter — Variance in packet delivery delay, measured in milliseconds (ms)
For information on interface bandwidth, see the Interface Summary Report.
This report is available in WatchGuard Cloud for Fireboxes that run Fireware v12.5.1 or higher. To view the report, you must configure one or more link monitoring targets for an interface. For more information about link monitoring, see Configure Firebox Network Link Monitoring.
How to Use this Report
This report can help you monitor interface connection quality statistics for a selected period of time. The report includes only interfaces that are configured in the link monitoring settings on your device. Here are some ways to use this report:
- Select the Summary tab to view loss, latency, and jitter for all monitored interfaces in a table. Each column displays the minimum, average, and maximum values.
- To view a line graph for a specific interface, on the Status tab, from the drop-down list, select the interface you want to view.
To calculate loss, latency, and jitter, the Firebox uses the 100 most recent probe results from link monitoring targets. Probe results are stored in groups of 10. When 10 groups are each filled with 10 probe results, probe results in the oldest group are cleared, and 10 new results are stored.
To calculate jitter, the uncorrected standard deviation is used. For detailed information about how jitter is calculated, see How is jitter calculated? in the WatchGuard Knowledge Base.
View the Report
To view the SD-WAN report in WatchGuard Cloud:
- Log in to WatchGuard Cloud.
- Select Monitor > Devices.
- Select a specific device.
- From the list of reports, select Health > SD-WAN.
The SD-WAN report opens.

- To select the report date range, click
 .
. - Select the Status tab to view loss, latency, and jitter in graph form.
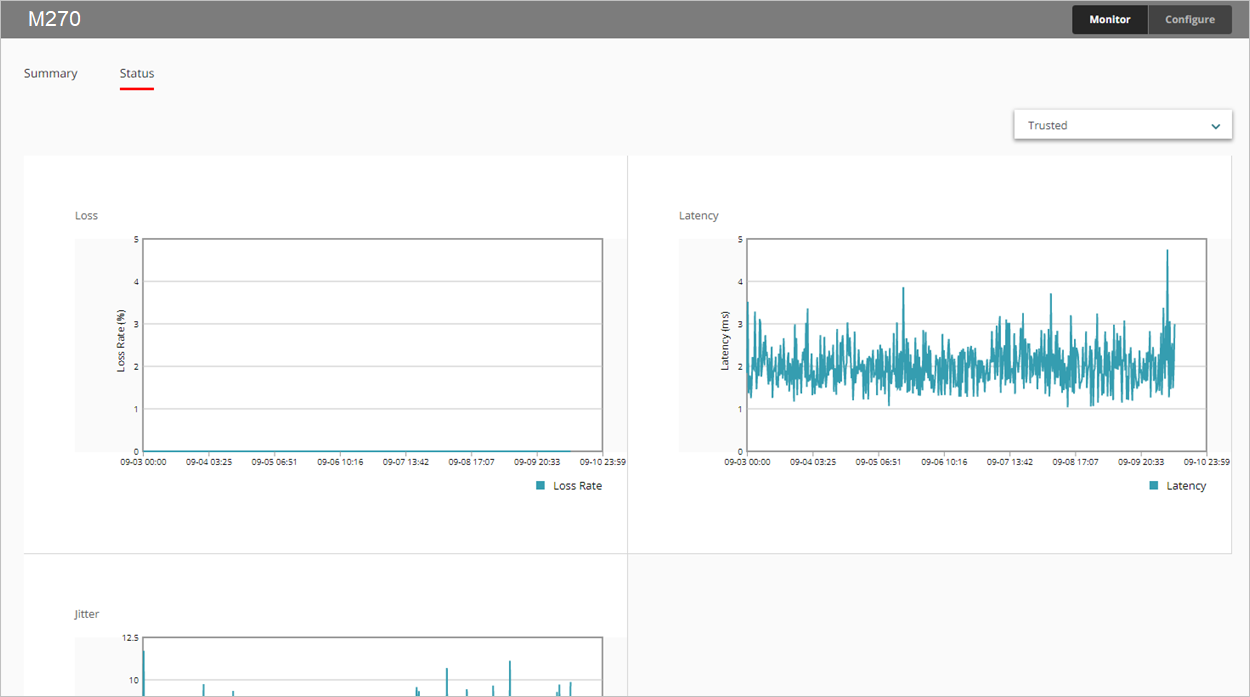
- To view data for a different interface, select an interface from the drop-down list in the upper right corner.
- To view loss, latency, or jitter data for a specific minute, point to the area on the graph.