Applies To: Locally-managed Fireboxes
On the Dashboard > Interfaces page in Fireware Web UI, these tabs show you detailed information about each Firebox interface:
- Bandwidth — Amount of data sent and received on all interfaces
- Details — Link status (up or down), interface status (enabled or disabled), link speed
- SD-WAN — Loss, latency, and jitter metrics for monitored interfaces.
In Fireware v12.2.1 or higher, you can see metrics for monitored external interfaces. In Fireware v12.4 or higher, you can see metrics for any monitored interface.
On the Bandwidth and Detail pages, you can also see this interface information:
- Name
- Zone
- IP address
- Gateway IP address
- Netmask
- MAC address
- DNS servers (Detail page only)
You can select to see data for these time ranges:
- Last 20 minutes
- Last 40 minutes
- Last hour
- Last 12 hours
- Last day
- Last 7 days
For Firebox Cloud, the Interfaces page includes different details. For more information about what appears on the Interfaces page for Firebox Cloud, go to View Firebox Cloud VM Information.
Bandwidth
On the Bandwidth tab, you can see the amount of bandwidth used for incoming and outgoing connections through each Firebox interface.
At the top right, you can select a time range. For example, if you select Last 20 Minutes, Sent and Received data for only the last 20 minutes appears.

For each interface, these details are included:
Zone
The trust zone for this interface.
IP Address
The IP address for this interface.
Gateway
The gateway defined for this interface.
Netmask
The network mask configured for this interface.
MAC
The MAC address defined for this interface.
Sent
Total amount of bandwidth used (in KB) for traffic sent over this interface.
Received
Total amount of bandwidth used (in KB) for traffic received over this interface.
Detail
To see detailed information about the Firebox network interfaces:
- Select Dashboard > Interfaces.
The Interfaces page appears with the Bandwidth tab selected by default. - Select the Detail tab.
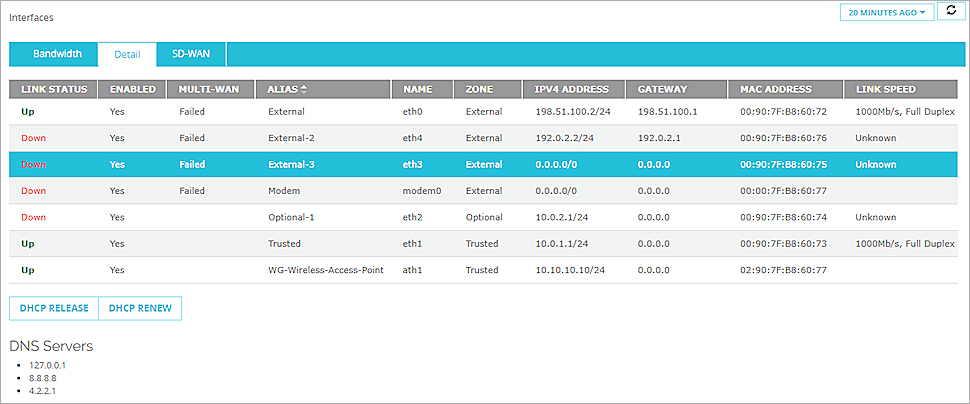
Detailed information about each interface appears.
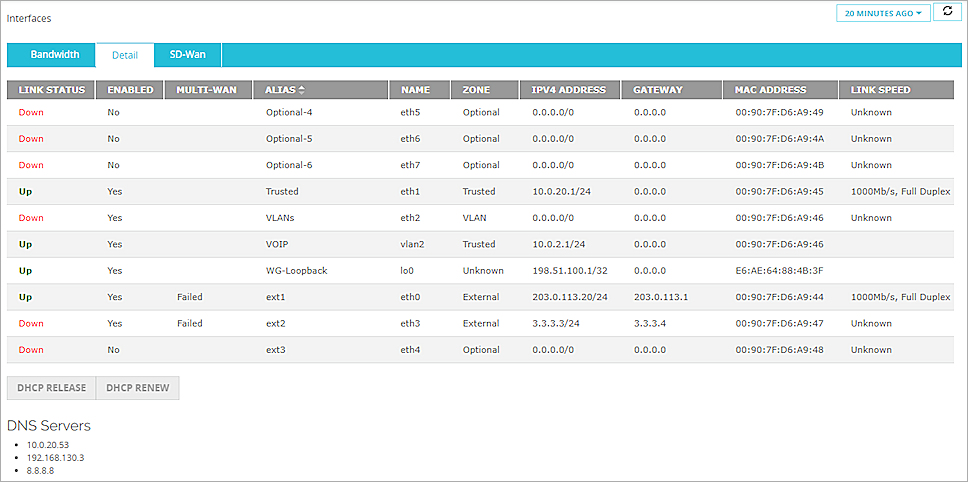
Link Status
If the interface is active, the status is Up. If it is not active, the status is Down.
Enabled
Indicates whether the interface is enabled or disabled.
Multi-WAN
Information about multi-WAN interface status. This column appears only when more than one External interface is configured on your Firebox.
Alias
The interface name.
Name
The interface number.
Zone
The trust zone for each interface.
IPv4 Address
The IPv4 address and network mask configured for the interface.
Gateway
The gateway defined for the interface.
MAC Address
The MAC address for the interface.
Link Speed
The link speed of the interface.
IPv6
The IPv6 address configured for the interface. For an interface that has IPv6 enabled, click the interface to see information about the IPv6 configuration. If IPv6 is configured for the interface, information about the IPv6 configuration appears in a text box.
DNS Servers
Several types of DNS servers can appear in this list:
- Network (global) DNS servers configured on the Firebox
- DNS servers from your ISP
- DNSWatch DNS servers, if DNSWatch is enabled
- Loopback address (127.0.0.1), if the DNS Forwarding or DNSWatch features are enabled
Interface DNS servers and Conditional DNS servers do not appear in the list.
For more information about DNS servers, go to About DNS on the Firebox.
Release or Renew a DHCP Lease
For any external interface with DHCP enabled, you can release or renew the DHCP lease on an IP address. This includes external VLAN interfaces.
- Select Dashboard > Interfaces.
The Interfaces page appears. - Select the Detail tab.
- Select an external interface with DHCP enabled.
The DHCP Release and DHCP Renew buttons are enabled at the bottom of the page.
- To release the DHCP lease for the selected interface, click DHCP Release.
- To refresh the DHCP lease for the selected interface, click DHCP Renew.
SD-WAN
In Fireware v12.3 or higher, the Firebox can use performance metrics to make SD-WAN routing decisions. For example, you can configure an SD-WAN action that routes traffic over another interface if the primary interface becomes congested.
On the SD-WAN tab, you can configure graphs that show real-time performance metrics for:
- External interfaces (Fireware v12.2.1 or higher)
- Internal interfaces (Fireware v12.4 or higher) Tip!
- BOVPN virtual interfaces (Fireware v12.4 or higher)
For more information about SD-WAN actions and policies, go to About SD-WAN and Configure SD-WAN.
To monitor an interface, you configure one or more Link Monitor targets for the interface. For more information about Link Monitor, see About Link Monitor.
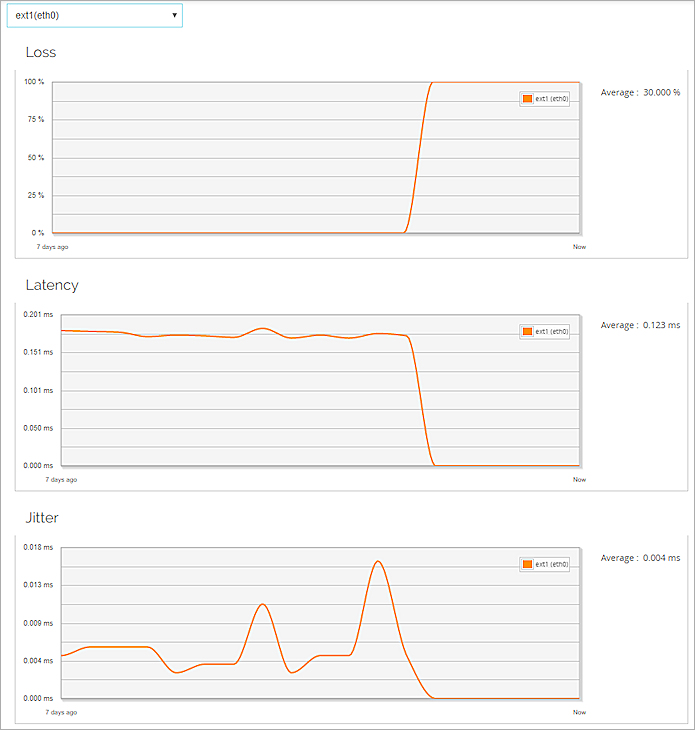
The SD-WAN page includes a graph for each of these measures:
- Loss — Percentage of packets lost
- Latency — Packet delivery delay, measured in milliseconds (ms)
- Jitter — Variance in packet delivery delay, measured in milliseconds (ms)
The Firebox uses the Link Monitor targets you specify for an interface to calculate loss, latency, and jitter. For example, if you specify 203.0.113.1 as a Link Monitor target for the interface eth0, the SD-WAN graph shows loss, latency, and jitter for communication between the eth0 interface and 203.0.113.1.
To calculate loss, latency, and jitter, the Firebox uses the 100 most recent probe results from link monitor targets. Probe results are stored in groups of 10. When 10 groups are each filled with 10 probe results, probe results in the oldest group are cleared, and 10 new results are stored.
To calculate jitter, the uncorrected standard deviation is used. For detailed information about how jitter is calculated, see How is jitter calculated? in the WatchGuard Knowledge Base.
In Fireware v12.2.1, the Firebox uses the 10 most recent probe results from Link Monitor targets, and the corrected standard deviation is used to calculate jitter.
Configure SD-WAN Monitoring
To see SD-WAN monitoring data for an interface:
- Link Monitor must be enabled for the interface.
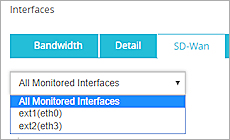
To see meaningful data, we recommend that you specify a Link Monitor target other than the default gateway. - On the Interfaces > SD-WAN page, the interface or the All Monitored Interfaces option must be selected.
To see SD-WAN monitoring data for FireCluster members:
- For an active/passive cluster, connect to the management IP address of the cluster master, or connect to an interface IP address. SD-WAN monitoring data is not available on a passive cluster member.
- For an active/active cluster, you must connect to the management IP address of the cluster master. SD-WAN data is not available on a passive cluster member or if you connect to an interface IP address.
In Fireware v12.4 or higher, if you configure a new external interface on the Firebox, you must manually add Link Monitor targets. In Fireware v12.2.1 to v12.3.x, if you configure a new external interface on the Firebox, the interface automatically participates in multi-WAN and has Link Monitor enabled.
Configure SD-WAN Graph Settings
On the SD-WAN page, the graph settings control:
- Which interfaces appear on the graph
You can show data for one interface or all monitored interfaces. - How much data to show
You can show data for the last 20 minutes, 40 minutes, 1 hour, 12 hours, 1 day, or 7 days.
- Select Dashboard > Interfaces.
- Click SD-WAN.
Three SD-WAN graphs appear. - From the drop-down list, select All Monitored Interfaces or a single interface.
- From the drop-down list in the upper-right, select Last 20 minutes, Last 40 minutes, Last 1 hour, Last 12 hours, Last 1 day, or Last 7 days.
Data appears in the loss, latency, and jitter graphs for the selected interfaces. - To manually refresh the page, click the refresh button
 .
.
Before you use SD-WAN monitoring data to make decisions about your network, we recommend that you establish baseline values that are specific to your network. To do this, look at the average loss, latency, and jitter values calculated for an extended span of time. As a best practice, we recommend that you consider the average values for the last 24 hours. Because Firebox System Manger shows only real-time data, to see values for a longer time period you must use the Web UI, which shows historical data for spans of time up to 7 days and calculates an average.
For information about how to interpret SD-WAN monitoring data in the Web UI, go to Interpret SD-WAN Monitoring Data.
- Select Dashboard > Interfaces.
- Click SD-WAN.
The SD-WAN graphs appear. - From the drop-down list, select a single interface.
The average value is not available if you select All Monitored Interfaces. - To the right of each graph, note the Average value.
For more information about the Dashboard pages, go to Monitor your Firebox with Fireware Web UI.