Applies To: Cloud-managed Fireboxes, Locally-managed Fireboxes
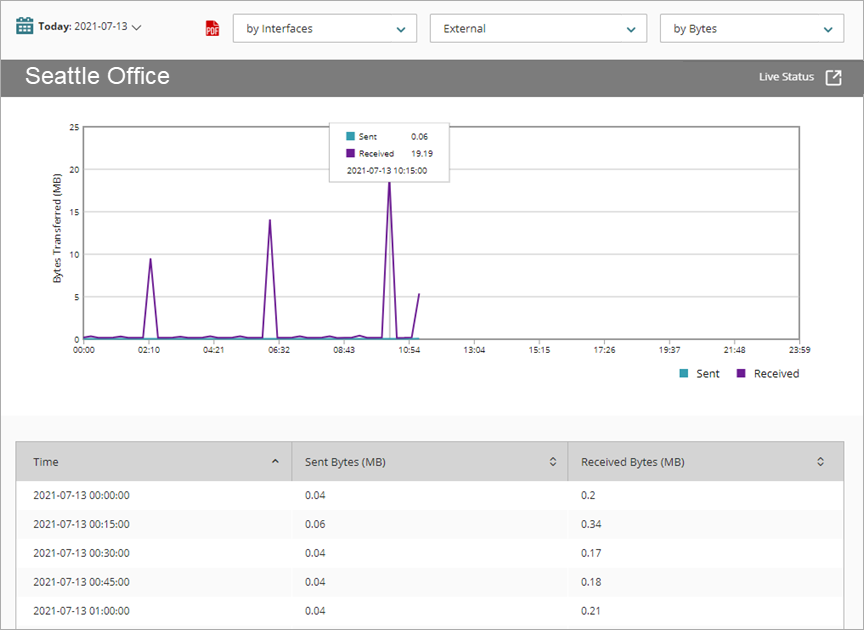
The Interface Summary report shows statistics and a chart of the data sent and received for each network interface.
Wireless interface statistics are available for devices that run Fireware v2026.1 and higher.
How to Use this Report
This report can help you to monitor activity on the network interfaces configured on your device. Here are some ways to use this report:
- Select a pivot to see traffic sent and received over a specific interface.
- Select the by Rate filter to identify slow network traffic over specific interfaces.
- Select the by Zone filter to see combined traffic statistics for interfaces of the same type (for example, all External interfaces).
View the Report
This report is available in WatchGuard Cloud and in Dimension.
In Dimension, this report does not include the option to view statistics by zone.
- Log in to WatchGuard Cloud.
- Select Monitor > Devices.
- Select a specific device.
- To select the report date range, click
 .
.
- From the list of reports, select Health > Interface Summary.
The Interface Summary report opens. By default, this report shows statistics (in Bytes) by interface.
- Use the drop-down lists at the top of the report to:
- Select whether to see report data by interfaces or zones
- Select the specific interface or zone
- Select the type of data
- To see reports for your Fireboxes or FireClusters, select Home > Devices.
The Devices list opens.
To see reports for your groups of Fireboxes, select Home > Groups.
The Groups list opens. - Select the Name of a Firebox, cluster, or group.
The Tools > Executive Dashboard page opens. - Select the Reports tab.
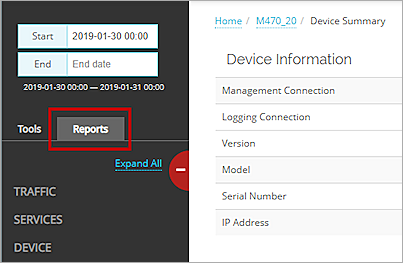
- Select Health > Interface Summary.
The Interface Summary report opens.
Pivots
You can use pivots to change the type of the data to show on the report.
To switch to a different view, select a pivot from the drop-down list above the report.
The report includes these pivots for the selected interface or zone:
By Bytes
Shows the amount of data received and sent, in bytes.
By Packets
Shows the number of packets received and sent.
By Rate
Shows the data transfer rate (kbps) of data received and sent.
Detail View
Detail view is not available for this report.