Applies To: Locally-managed Fireboxes
You can select the level of diagnostic logging that appears in the log messages generated by your Firebox. The available levels, from lowest to highest are:
- Off — No diagnostic log messages are sent for this category.
- Error — (Default setting) This level includes log messages for serious errors that cause a service or process on the Firebox to terminate.
- Warning — This level includes details of abnormal conditions that help to explain behavioral process issues, as well as the information from the Error level.
- Information — This level includes details of successful operation for log messages, as well as the information from the Error and Warning levels.
- Debug — This level includes detailed log messages for all log levels. Use only with direction from a WatchGuard technical support representative.
These levels are the same as the equivalent syslog severity levels. WatchGuard only uses the Error, Warning, Information, and Debug levels. For more information about how to log to a syslog server, go to Configure Syslog Server Settings.
WatchGuard does not recommend that you select the highest logging level (Debug) unless a technical support representative directs you to do so while you troubleshoot a problem. When you use the highest diagnostic log level, the log file can fill up very quickly and performance of the Firebox can be reduced.
For more information about how to review log messages in Dimension, go to View Log Messages (Dimension).
For more information about how to review log messages in Traffic Monitor, from Fireware Web UI, go to Traffic Monitor.
For more information about how to review log messages in Traffic Monitor, from Firebox System Manager, go to Device Log Messages (Traffic Monitor).
In Fireware v12.5.4 and higher, the Firebox sends diagnostic log messages to WatchGuard Cloud only when Support Access is enabled. For more information, see Support Access to Your Firebox.
WatchGuard Cloud stores diagnostic log messages sent by a Firebox, but they are not visible in Log Manager or Log Search. If you need to troubleshoot an issue, you can request these diagnostic log messages from WatchGuard Technical Support.
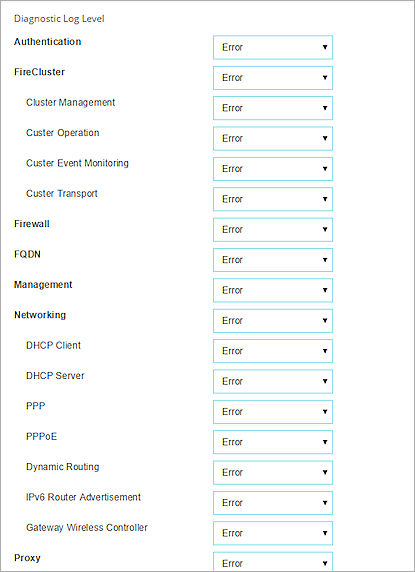
- Select System > Diagnostic Log.
The Diagnostic Log Level page appears.

- From the drop-down list for each category, select the level of detail to include in the log message for that category:
- Off Tip!
- Error
- Warning
- Information
- Debug
- Click Save.
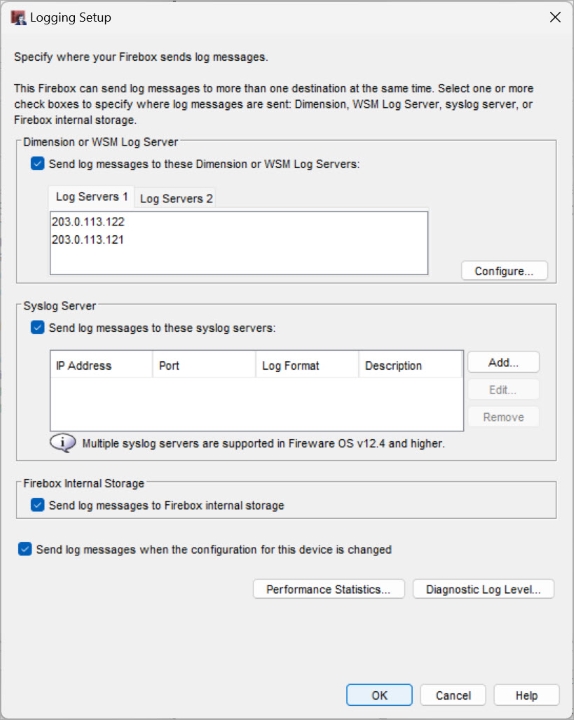
- Select Setup > Logging.
The Logging Setup dialog box appears.

- Click Diagnostic Log Level.
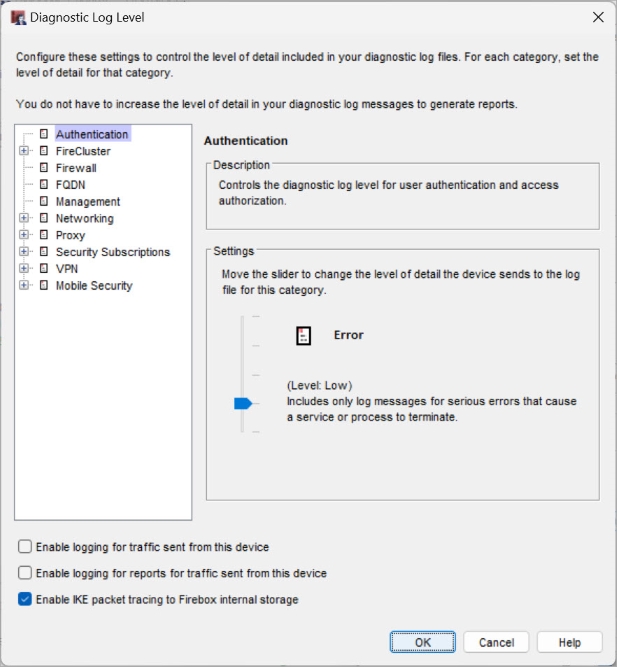
The Diagnostic Log Level dialog box appears.

- Select a category from the list.
A description of the category appears in the Description box. - Use the Settings slider to select the level of detail to include in the log message for each category.
- Off Tip!
- Error
- Warning
- Information
- Debug
- To send log messages about traffic the Firebox sends, select the Enable logging for traffic sent from this device check box.
- To send log messages about traffic the Firebox sends, that can be used to generate reports, select the Enable logging for reports for traffic sent from this device check box.
- To enable the Firebox to collect a packet trace for IKE packets, select the Enable IKE packet tracing to Firebox internal storage check box.
- Click OK to save your changes.
The Diagnostic Log Level dialog box closes and the Logging Settings dialog box appears.
Device Log Messages (Traffic Monitor)
Traffic and Performance Statistics (Status Report)
Configure Logging Settings and Performance Statistics (Web UI)