Applies To: Locally-managed Fireboxes
An important feature of network security is to gather messages from your security systems, to examine those records frequently, and to keep them in an archive for future reference. The WatchGuard log message system creates log files with information about security related events that you can review to monitor your network security and activity, identify security risks, and address them.
A log file is a list of events, along with information about those events. An event is one activity that occurs on the Firebox. An example of an event is when the Firebox denies a packet. Your Firebox can also capture information about allowed events to give you a more complete picture of the activity on your network.
From Dimension, you can view log messages for the connected Fireboxes, FireClusters, or WatchGuard servers that send log messages to your Dimension server. Log Manager enables you to see log messages from your Firebox for any period of time you specify, if log messages were generated in the selected time frame.
When Dimension stores log messages, it converts the time stamps to the UTC time zone. When you view reports in Dimension, time stamps appear in your local time zone.
Log messages are sent to your Dimension server in XML (plain text) format and are encrypted for transit with an SSL connection (AES 256-bit). Log data is not encrypted while stored in the Dimension server log message database.
On the Devices page tabs, all of the Fireboxes and FireClusters that send log messages to your Dimension server appear. On the Servers page, all of the WatchGuard servers that send log messages to your Dimension server appear. On these pages, you can select any Firebox, FireCluster, or server to see the log messages for that Firebox, FireCluster, or server, even if the Connected status is No. When you select a Firebox, FireCluster, or server, the log messages page appears with a log frequency graph at the top of the log messages list that shows the range of log message data for your selected Firebox, FireCluster, or server. The default setting for the log frequency graph is a bar chart, but you can also see the data in a line chart. You can select the time range to see log messages. You can also filter the list of log messages by type and search the log messages for specific log data details.
If you change the name of a FireCluster, to see log messages that were generated by the FireCluster before you changed the name, you must select the FireCluster by the name that was specified for it when those log messages were generated. After you change the name of the FireCluster, you must select the FireCluster by the new name to see the log messages that are generated after the name is changed.
The information that is available in the log messages list depends on the log type you select.
| Log Type Button | Log Type | Result Information |
|---|---|---|
|
|
Traffic | Disposition, Date-Time, Source, Interface, Destination, Port, Interface, Protocol, Policy |
|
|
Alarm | Date-Time, Alarm Name, Message |
|
|
Event | Date-Time, Process, Priority, Message |
|
|
Diagnostic | Date-Time, Process, Message |
|
|
Statistic | Date-Time, Device, Bytes Received, Bytes Sent |
|
|
All | Type, Date-Time, Detailed Message |
View Log Messages
- To see the log messages for your Fireboxes or FireClusters, select Home > Devices.
The Devices page opens, with the List tab selected.
To see the log messages for a group of Fireboxes, select Home > Groups.
To see the log messages for a WatchGuard server, select Home > Servers. - Select the Name of a Firebox, cluster, group, or server.
The Tools > Executive Dashboard page opens. - From the Start and End drop-down calendars, select the start and end date and time for the log messages, then click Apply. Tip!
- From the LOGS section, select Log Manager.
The log messages for the selected device, cluster, or server appear, with the traffic log messages displayed by default.
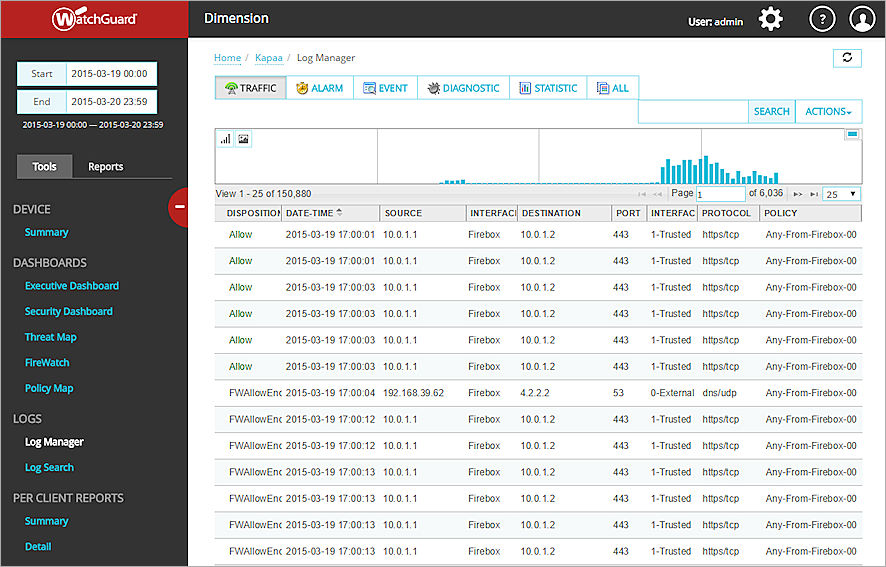
Example of the Log Messages page for a Firebox.
- To filter the log messages for a Firebox by another log type, click a log type button.
This option is not available for servers. The Log Messages list changes to only include messages of the selected log type. - To see a line chart of the log message data, click
 .
.
To see a bar chart of the log message data, click .
.
This is the default setting. - To zoom in on a section of the log frequency graph and see a smaller data set, place your mouse cursor over the graph, hold down your left mouse button, and drag the cursor to select a time range.
- To zoom out to the original time setting, click
 .
. - To see more detailed information about a log message in the list, click that log message.
A dialog box opens with additional information about the log message you selected. - To copy the content of the message, highlight the message text, right-click the highlighted text and select Copy, or press Ctrl+C on your keyboard.
Search Log Messages
You can use the Search feature to refine the log messages that appear for any of your Fireboxes or servers. On the Log Messages page, you can run a simple search to filter the messages in the Log Messages list.
For information about how to run a more advanced search of your Firebox log messages, see Search Device Log Messages in WebCenter. Advanced search parameters are not available for servers.
To run a search from the Log Messages page:
- In the Search text box, type the text to search for in the log messages.
- Click
 .
.
The log message display is updated to include only those log messages that match the search parameters.
See a Timeslice Analysis
The Timeslice Analysis chart is a pie chart that shows the total number of log messages, the average arrival rate of log messages (per minute or per second), and the percentage of each type of log message sent to the Dimension server from a Firebox in the specified time range. The Timeslice Analysis is not available for log messages from your servers.
To see a Timeslice Analysis for a Firebox:
- In the Devices list, select the Name of a Firebox.
The log messages page for the selected device opens, with only the Traffic log messages displayed. - From the Actions drop-down list, select Timeslice Analysis.
The Timeslice Analysis chart appears in a new dialog box.
Export Log Messages
You can export the log messages for any device or server to a CSV file. When you export log messages, a CSV file is created with the log messages that were available for the device you selected in the time range you specified. This CSV file is automatically added to a ZIP file. The file name of the CSV file included in the ZIP file is the date and time range for the log messages in the file. The ZIP file includes a text file with the search parameters. The ZIP file name is the serial number of the device, as well as the date and time range for the log messages. If you choose to save the ZIP file to a location on your computer, you can specify any file name.
- In the Devices list, select the Name of a device.
The log messages page for the selected device opens. - From the Actions drop-down list, select Export logs (.csv).
An Opening file dialog box opens for the ZIP file. - Select whether to open the ZIP file or save it to a location on your computer.
- Click OK.
- If you save the file, browse to select a location.
- (Optional) Type a file name for the ZIP file.
- Click Save.
The ZIP file is saved to the specified location on your computer. - Browse to the location where you saved the ZIP file and open the file.
- Extract the CSV file.
You can now open the CSV file and review the log messages, or import the CSV file to another program. When you export log messages to a CSV file, the time zone that appears in the file is the local time on the client computer.