Spectrum Analysis
Applies To: Wi-Fi Cloud-managed Access Points (AP125, AP225W, AP325, AP327X, AP420)
Spectrum analysis helps you detect various types of interference, non Wi-Fi interference, or interference that can also be transient in nature that decreases the performance of your wireless network. Spectrum analysis enables you to visualize the radio frequencies operating in your area and determine the strength of the detected signals.
-
Spectrum analysis is only supported on APs with a third scanning radio (AP225W, AP325, and AP420). The third radio allows a dedicated source for a consistent spectrum analysis. When spectrum analysis is started, the third radio switches from scanning mode to spectrum analysis mode and the third radio stops regular scanning.
- Spectrum analysis can be started only on one AP at a time
- Spectrum analysis cannot be triggered on an AP that is performing prevention or packet capture activity
- If spectrum analysis is already running on a device:
- You cannot start spectrum analysis on the device again
- You cannot trigger any prevention on that device
- You cannot trigger packet capture for that device
Start Spectrum Analysis
To start Spectrum Analysis:
- Select Monitor > WiFi, then select the Access Points tab.
- Right-click on an active AP, then select Spectrum Analysis > Run Spectral Scan.
- In the Spectrum Analysis dialog box, select the band on which you want to perform analysis and the duration.
The duration determines how long the spectrum data will be collected after which the spectrum analysis will automatically stop on the selected AP. The default value for duration is 5 minutes and the maximum value is 30 minutes.
- Click Start.
A new browser window opens to display the Spectrum Analysis graph.
Stop Spectrum Analysis
To stop analysis at any time, in the Spectrum Analysis window, click Stop.
Spectrum analysis automatically stops after the timeout duration configured for the AP.
The AP's third radio returns to Scanning mode when spectrum analysis is stopped.
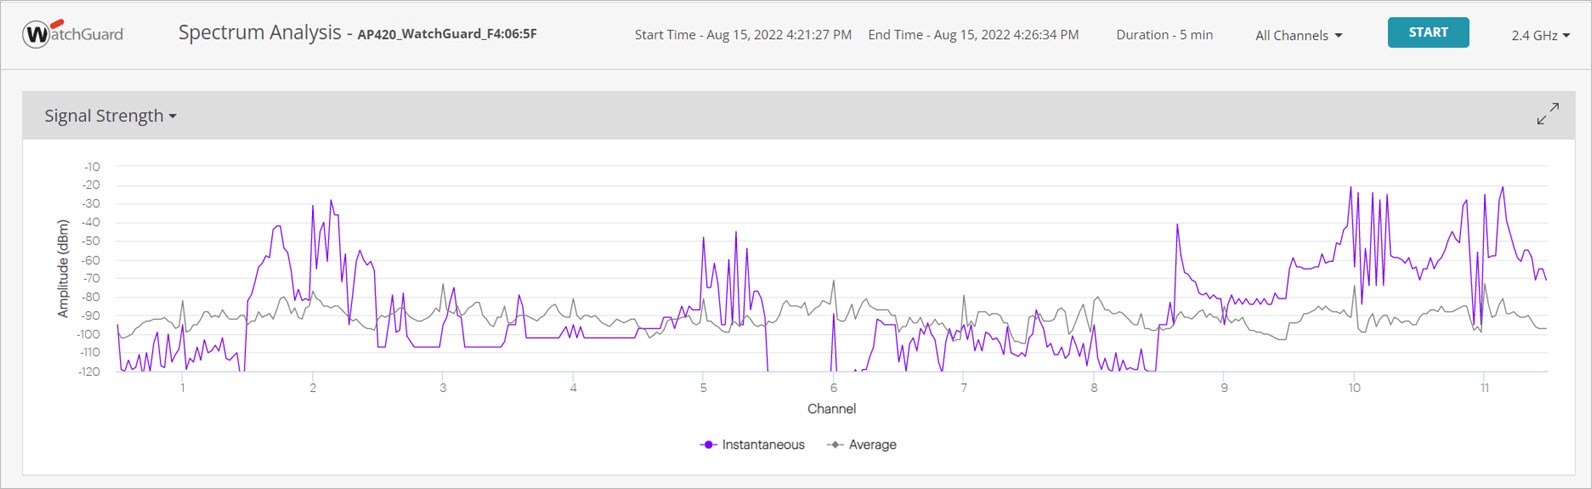
Signal Strength
The Signal Strength chart shows instantaneous and average signal strength measurements for each channel.
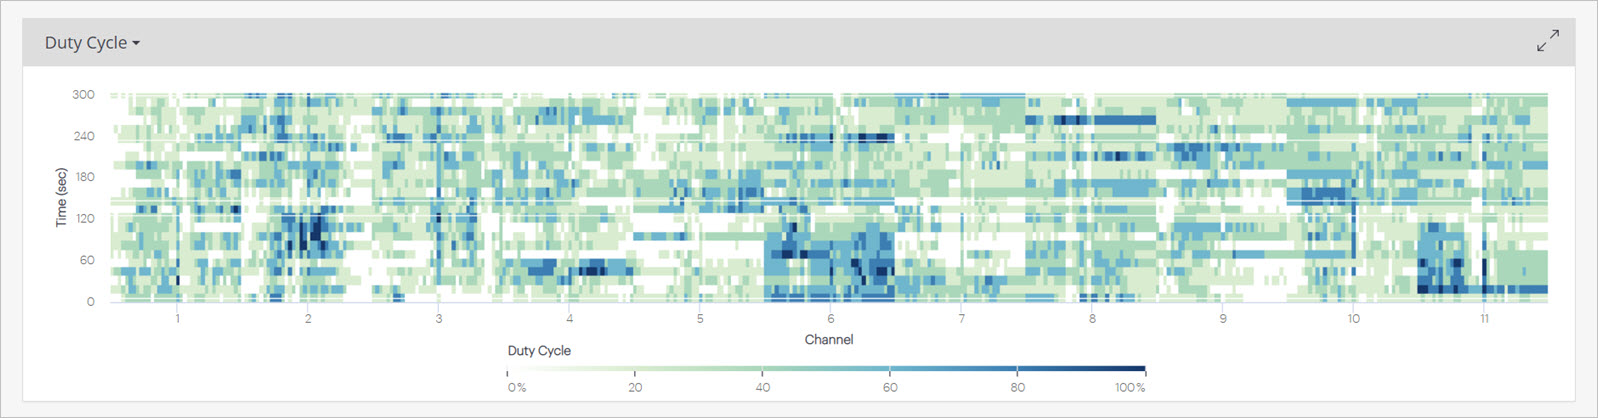
Duty Cycle
The Duty Cycle chart show the level of activity on a channel at that a specific time. Darker colors indicate greater activity on the channel during the time period.
Spectrogram
Discover produces a swept spectrogram to depict the signal power over time for a selected frequency band.

In the spectrogram, the purple color indicates low power levels, and the red color indicates high power levels. The other shades of colors from light blue, green, yellow, and orange, indicate intermediate power levels.
- Purple — Low Power: -95 dBm
- Red — High Power: -25 dBm
The swept spectrogram tracks signal power over time and produces a color-coded sweep of spectral information so that you can view the real time data and historical values. The swept spectrogram displays the frequency on the horizontal axis, and the vertical axis tracks time. For each sweep, a new line is plotted on the horizontal axis. The entire spectrogram moves from the bottom of the screen upwards and the oldest plots are removed from the top.
During spectrum analysis, the AP periodically sends analysis data to Wi-Fi Cloud. During this period, the scanning radio of the AP scans through all frequencies of the band that is selected and sends the data to Wi-Fi Cloud. The spectrum analysis resolution is 312 kHz.
The data obtained through this analysis includes:
- Frequency band (2.4 GHz or 5 GHz)
- Channel number (depends upon the configuration in the template for the number of channels to scan)
- Channel width
- Number of samples
- Signal strength for each sample
You can trigger another spectrum analysis scan from the same window by selecting a different band and timeout duration from the top-right corner of the window.
Spectrum Density
The Spectrum Density chart shows the time distribution of channel signal strength. This indicates the percentage of the scan duration when the signal strength of a channel was stronger or weaker than a particular signal strength.
