Spectrum Occupancy
Applies To: Wi-Fi Cloud-managed Access Points (AP125, AP225W, AP325, AP327X, AP420)
The date is averaged over 15 minute intervals.
You can select the frequency band (such as ISM, UNI-1, UNI-2, UNI-3, UNI-4) and the time interval from the top-right corner of the widget.
Click RF Explorer to view the RF airspace around the AP. For more information, see RF Explorer.
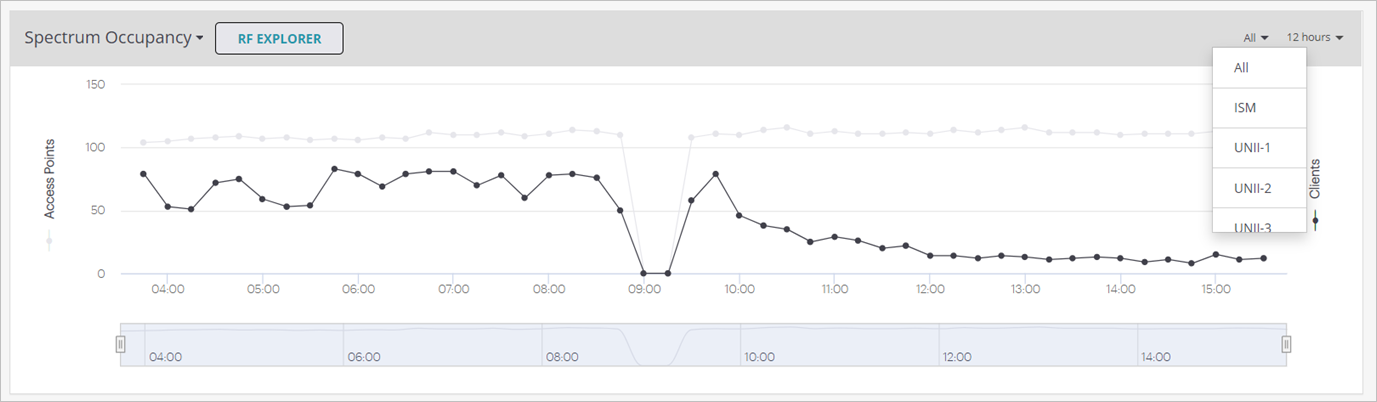
Charts that show information about channels other than the operating channels of the AP show the most accurate information when the AP has a dedicated scanning radio. APs that use background scanning show a snapshot of the network that might have changed since the time of the last scan.
Channel Map
The Channel Map shows the number of clients and APs visible to the managed AP on a specific channel. You can use this information to identify congested or underutilized channels in a specific wireless band.
To view the Channel Map, select Channel Map from the drop-down menu in the Spectrum Occupancy widget.
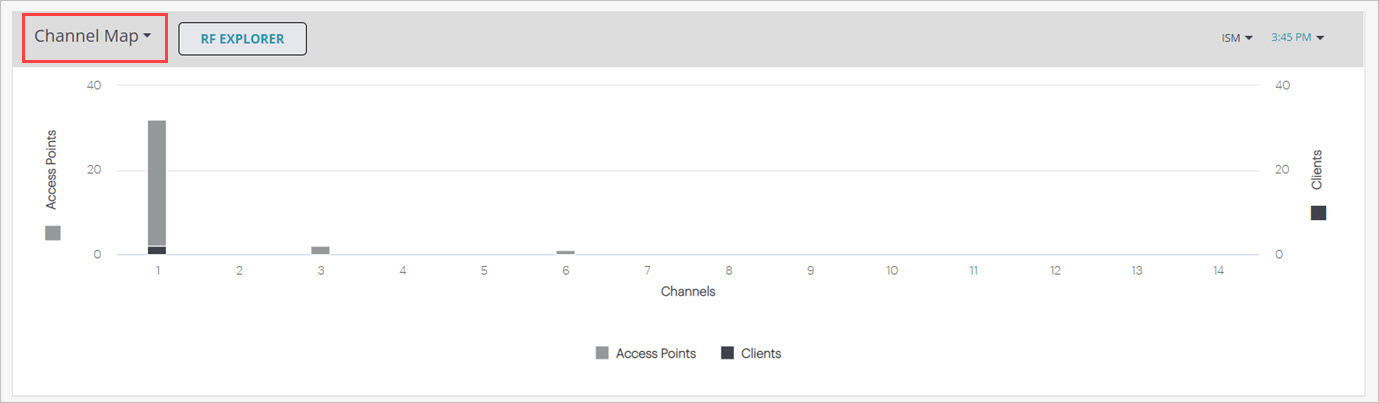
You can select the frequency band (such as ISM, UNI-1, UNI-2, UNI-3, UNI-4) and the time interval from the top-right corner of the widget. Channel Map data is available up to 12 hours previous to the current time. Hover over the chart to view the number of APs and clients on a specific channel.