Heat Maps
Applies To: Wi-Fi Cloud-managed Access Points (AP125, AP225W, AP325, AP327X, AP420)
You can select different heat map views for your network:
- AP Coverage View
- AP Link Speed View
- AP Channel Coverage View
AP Coverage View
The AP Coverage heat map view uses a color-coded view of the RSSI (Received Signal Strength Indicator) to indicate the signal strength. Use this view to determine if there are any AP coverage gaps in your AP placement.

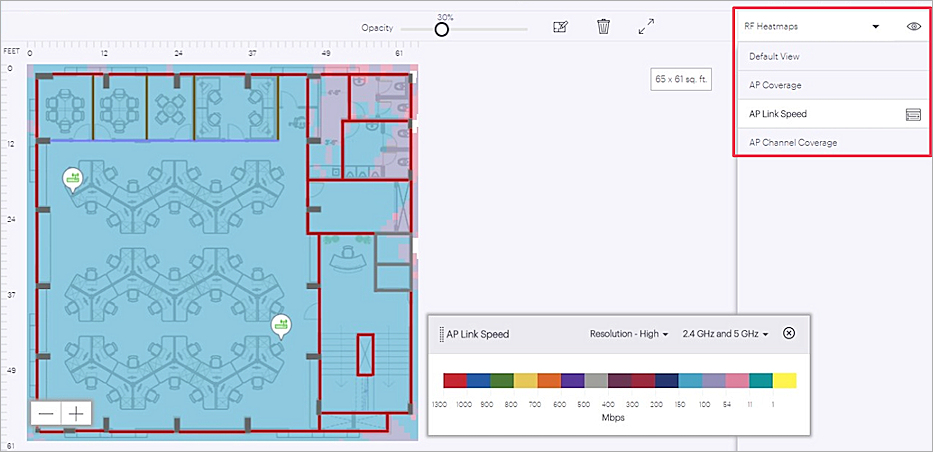
AP Link Speed View
The AP Link Speed heat map view uses a color-coded view of the data rates between clients and APs in Mbps. Use this view to determine any degradation in link speed for different areas of your network.
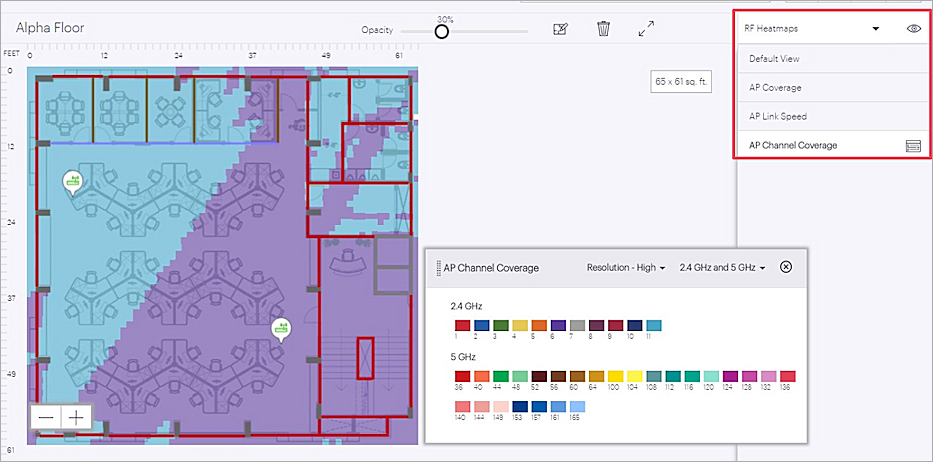
AP Channel Coverage View
The AP Channel Coverage heat map view uses a color-coded view of the channels in use. Use this view to see what channels are in use in your network and determine if there are overlapping channels.