With the information in the capacity planning section of this guide, you can determine how many APs are required for specific deployment use cases. In this section, you determine where to put the APs and the wireless channels to use.
Wireless Signal Strength and Noise Levels
To make sure that all users in your environment receive a strong wireless signal, consider these guidelines when you install your WatchGuard APs.
Signal Strength
The signal strength is the wireless signal power level received by the wireless client.
- Strong signal strength results in more reliable connections and higher speeds.
- Signal strength is represented in dBm format (0 to -100). This is the power ratio in decibels (dB) of the measured power referenced to one milliwatt.
- The closer the value is to 0, the stronger the signal. For example, -41 dBm is a stronger signal than -61 dBm.
Noise Level
The noise level indicates the amount of background noise in your environment.
- If the noise level is too high, it can degrade the strength and performance of your wireless signal.
- Noise level is measured in dBm format (0 to -100). This is the power ratio in decibels (dB) of the measured power referenced to one milliwatt.
- The closer the value to 0, the greater the noise level.
- Negative values indicate less background noise. For example, -96 dBm is a lower noise level than -20 dBm.
Signal to Noise Ratio
The signal-to-noise ratio (SNR) is the ratio between the signal strength and the noise level.
- This value is represented as a dB value.
- In general, your signal-to-noise ratio should be +25 dB or higher. Values lower than +25 dB result in poor performance and speeds.
For example:
- If you have a -41 dBm signal strength, and a -50 dBm noise level, this results in a poor signal-to-noise ratio of +9 dB.
- If you have a -41 dBm signal strength, and a -96 dBm noise level, this results in an excellent signal-to-noise ratio of +55 dB.
RF Interference
Interference caused by Wi-Fi or non-Wi-Fi devices can greatly reduce performance of wireless networks. To optimize the performance of your wireless network you must be able to identify, locate and avoid sources of interference. To help you to identify sources of interference, you can perform a spectrum analysis during the pre-installation and post-deployment phases .
Wi-Fi Interference Sources
- Personal hotspots
- Malfunctioning clients
- Poorly designed wireless network or misconfiguration
- Neighborhood APs and clients external to your network
Non-Wi-Fi Interference Sources
- Video game controllers
- Microwave ovens
- Security cameras
- ZigBee devices
- Cordless phones
- Bluetooth devices
Microsoft Xbox Game Controller
Game controllers for the Microsoft Xbox use non-Wi-Fi 2.4 GHz wireless technology. Game controllers use their own frequencies and use frequency-hopping. Though the channel utilization of these devices is quite low, these controllers can adversely affect Wi-Fi performance in the 2.4 GHz band.
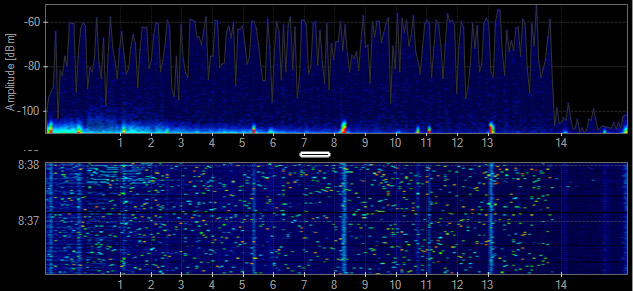
Xbox game controller frequency spectrum chart. Source: Metageek
Microwave Oven
Microwave ovens operate in the upper channels of the 2.4 GHz band. Microwave ovens have been known to have severe impacts on performance for nearby APs and clients operating on channels 6 to13. Do not put APs near microwave ovens, but when it is unavoidable, we recommend you use channel 1 for the 2.4 GHz radio.
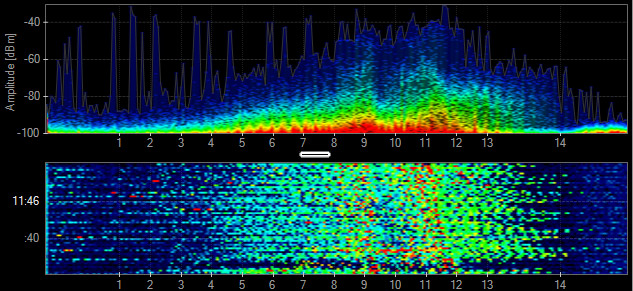
Microwave oven frequency spectrum chart. Source: Metageek
Bluetooth
Bluetooth devices are frequency hoppers that can affect all channels in the 2.4 GHz band. Fortunately, Bluetooth devices do not stay on a single frequency for very long and they operate with relatively low power, so their impact is limited.
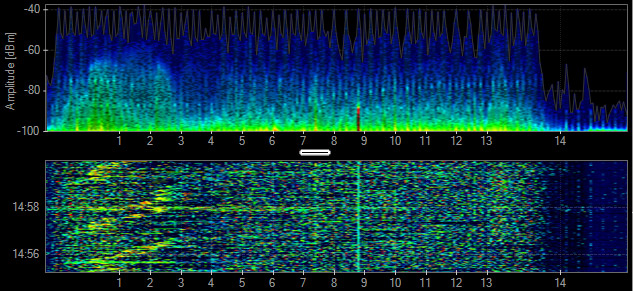
Bluetooth frequency spectrum chart. Source: Metageek
Wi-Fi Cloud Smart Spectrum
The Smart Spectrum feature in WatchGuard Wi-Fi Cloud detects and identifies interference sources, both Wi-Fi and non-Wi-Fi. The interference data is collected by the DCS (Dynamic Channel Selection) algorithm for more informed AP channel changes that result in improved overall network performance and user experience.
When you enable ACD/DCS (auto channel) selection, APs select channels to avoid both Wi-Fi and non-Wi-Fi interference. It is preferable that wireless networks not routinely change their channel plan because channel plan changes can be disruptive to the wireless network.
Unwanted sources of interference from devices such as rogue APs, cordless phones, and non-Wi-Fi cameras can reduce wireless network performance. To mitigate this issue, provide a spectrum policy that informs all users about the types of devices that are not permitted at your deployment site.
Additional sources of interference are even more of a problem for static channel plans, (where auto channel selection is disabled), because manual intervention is required to locate and remove the source of the interference or to change the channel plan to avoid the interference. We recommend you have a spectrum policy to help minimize wireless network disruptions caused by sources of interference introduced into your network.
Spectrum Analysis with Discover
In WatchGuard Discover, you can perform Spectrum Analysis that helps you detect various types of interference, non Wi-Fi interference, or interference that can also be transient in nature that decreases the performance of your wireless network. Spectrum analysis enables you to visualize the radio frequencies operating in your area and determine the strength of the detected signals.

Signal Strength, Channel Width, and QAM
This table shows the approximate signal strengths required to support MCS rates for various channel widths. 256-QAM requires higher signal strengths than 64-QAM because of the greater constellation density required to support 256-QAM. However, wider channels also require higher levels of signal strength compared to narrow channels to support a given modulation scheme.
For example, 64-QAM/MCS-7 requires -62 dBm for 40 MHz channels, but the requirement jumps to -58 dBm for 80 MHz channels. To design a network to support 256-QAM/MCS-9 with 80 MHz channels pervasively, requires a signal strength of -52 dBm or higher throughout the deployment. This means that APs should be located every 30 to 50 feet, depending on the environment, clients, and AP capabilities. While there may be high density and high /throughput use cases (such as an auditorium) where designing for 256-QAM is recommended, most high density deployments are designed to support 64-QAM pervasively.
|
Signal Strengths Required to Support MCS Rates for Various Channel Widths |
|||||
|---|---|---|---|---|---|
|
Modulation Scheme |
20 MHz |
40 MHz |
80 MHz |
80+80 MHz |
160 MHz |
|
11ac 64-QAM/MCS-7 |
-64 dBm |
-62 dBm |
-58 dBm |
-55 dBm |
-55 dBm |
|
11ac 256-QAM/MCS-8 |
-59 dBm |
-56 dBm |
-53 dBm |
-50 dBm |
-50 dBm |
|
11ac 256-QAM/MCS-9 |
-58 dBm |
-54 dBm |
-52 dBm |
-49 dBm |
-49 dBm |
Higher density modulation requires higher levels of signal strength, and wider channels require higher signal strength compared to narrower channels. As a result, the cell size for an AP that supports 256-QAM is much smaller than that of an AP that supports 64-QAM, as shown in this diagram.

Predictive Site Survey
Use a predictive site survey software application to develop an AP placement plan estimate coverage and capacity. You can use a predictive site survey planning application to generate a recommended AP placement and channel plan, including coverage, SNR, and interference information to help with your deployment.
You must provide input on these factors for correct capacity planning:
- Client types and quantity (currently in use and anticipated growth)
- Applications (currently in use and anticipated growth) and streaming media requirements
- Design for capacity
- High-quality floor maps
- Precise scale for the floor plan
- Consideration of possible RF leaks between floors
WatchGuard provides to partners a Wi-Fi Customer Requirements Questionnaire to assist in creating predictive site surveys. For more information, log in to your partner account on the WatchGuard web site and go to Product > Selling Secure Wi-Fi.
Indoor Attenuation Reference
To make sure you have an accurate predictive site survey, measure the actual attenuation values for obstructions within the deployment site. You can use these attenuation values in your site survey. To measure attenuation values, you must use an AP and a smart phone with an application such as WiFi Analyzer.
To perform the measurement, check the signal level detected by the client when the client and AP are 5 meters apart with a clear line of sight (LoS). Then, check the signal level again at the same distance with the obstruction between the AP and the smart phone.
The difference between the LoS (line of sight) reading and the second reading is the measure of attenuation level for the obstruction. The attenuation values you obtain can improve the accuracy of your predictive site survey.
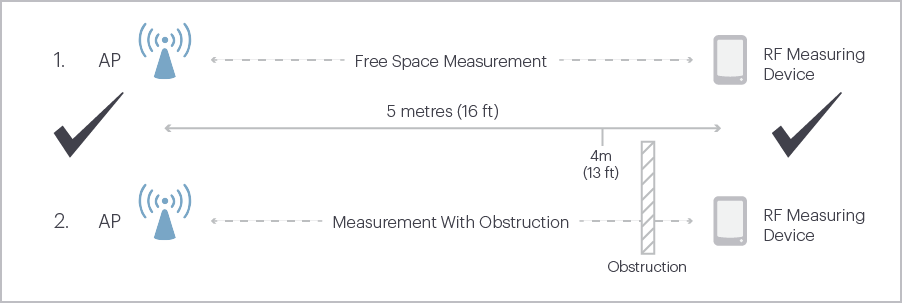
Example:
- Measurement 1: 5 Meters LoS = -54 dBm
- Measurement 2: 5 Meters behind obstruction = -57 dBm
- Obstruction Attenuation = 3 dB
This table shows the estimated values of attenuation for common materials found in typical deployments. Note the variability in attenuation for a specific type of material (for example, concrete and brick wall +/- 10 dB). Precise attenuation values produce a more accurate predictive site survey.
|
Attenuation Estimations |
||
|---|---|---|
|
RF Attenuators |
Estimated Attenuation in 2.4 GHz |
Estimated Attenuation in 5 GHz |
|
Steel door |
16 dB (+/- 3 dB) |
28 dB (+/- 3 dB) |
|
Concrete or brick wall |
12 dB (+/- 6 dB) |
20 dB (+/- 10 dB) |
|
Coated or double-pane |
12 dB (+/- 1 dB) |
20 dB (+/- 1 dB) |
|
Cubicle wall |
4 dB (+/- 1 dB) |
6 dB (+/- 2 dB) |
|
Wood door |
4 dB (+/- 1 dB) |
6 dB (+/- 1 dB) |
|
Glass or window (not tinted) |
3 dB (+/- 1 dB) |
7 dB (+/- 1 dB) |
|
Drywall (interior) |
3 dB (+/- 1 dB) |
4 dB (+/- 1 dB) |
|
Ceiling tiles, curtains, blinds |
1 dB (+/- .5 dB) |
2 dB (+/- 1 dB) |
Rule of 10s and 3s
You can increase or decrease power due to several factors such as antenna gain and attenuation loss due to distance between APs and clients
- If you lose -3 dB, you lose 1/2 your original power
- If you gain +3 dB, you gain 2x your original power
- If you lose -10 dB, this is 1/10 your original power
- If you gain +10dB, you have 10x your original power
One-for-One AP Replacement
Before you choose a one-for-one AP replacement approach, make sure these conditions are true:
- The current wireless network provides correct coverage everywhere (for example, -62 dBm).
- All clients can detect two to three APs in all locations.
- The current network is designed for capacity.
- All applications perform correctly.
- The environment has remained the same (for example, no building renovations) since the existing AP placement plan was created.
- The current network is designed for 5 GHz.
- All clients can roam successfully.
Avoid Self Induced CCI in 2.4 GHz
Even if DFS channels are not used, 5 GHz channels outnumber 2.4 GHz channels by a wide margin. This means that if both 5 Ghz and 2.4 GHz radios are active on all APs in a network designed for capacity, there is a high probability that the APs could create harmful co-channel interference (CCI) in the 2.4 GHz band. Another factor is that 2.4 GHz frequencies provide greater coverage range than 5 GHz frequencies. To minimize the amount of self-induced CCI in the 2.4 GHz band, we recommend you disable 2.4 GHz radios on some of the deployed APs .
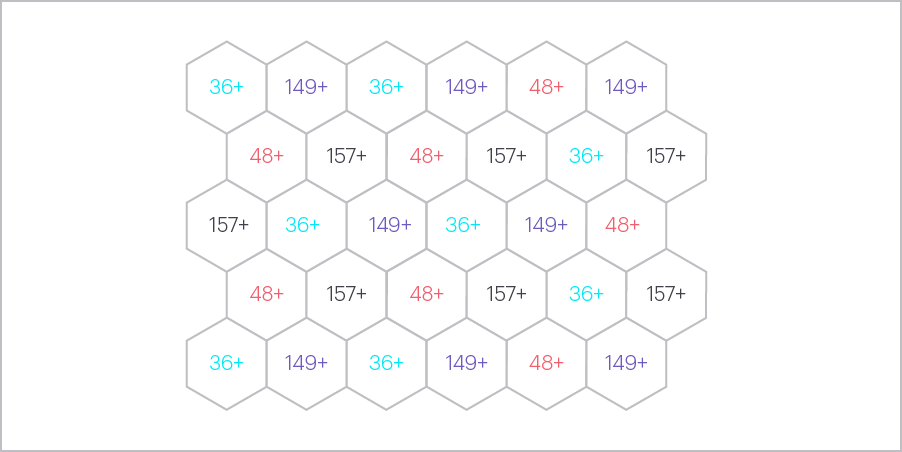
40 MHz Channel Plan
The diagram below is an example of a 40 MHz channel plan that does not use DFS channels. In the US, as well as in several other regions, there are only four non-overlapping 40 MHz channels available if DFS channels are not used. The example plan minimizes CCI because adjacent APs do not use the same frequencies.
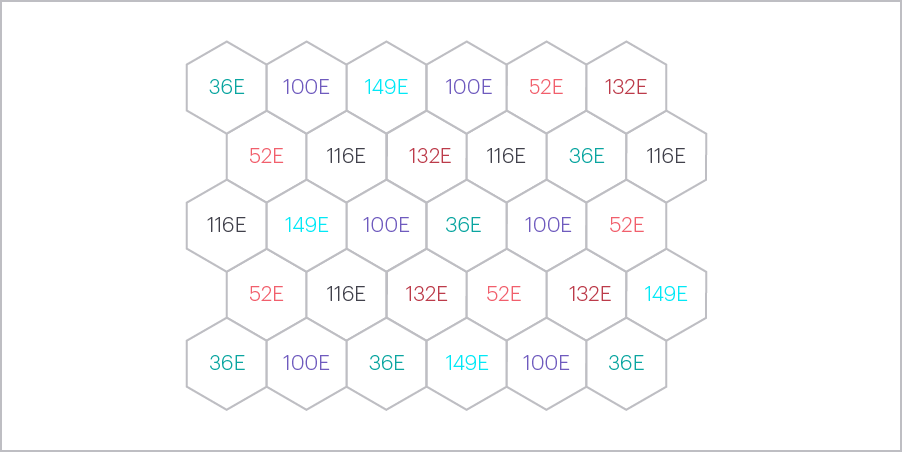
80 MHz Channel Plan
This is an example of an 80 MHz channel plan that uses DFS channels. In the US, as well as in several other regions, there are six non-overlapping 80 MHz channels available if DFS channels are used. As with the 40 MHz plan, the example plan minimizes CCI because adjacent APs do not use the same frequencies.
AP Mounting Recommendations
WatchGuard APs for indoor use are usually mounted on walls or ceilings. Outdoor APs are usually mounted on walls and poles.
More information about mounting options are provided in the WatchGuard AP Hardware Guides.
Information about WatchGuard AP antenna radiation patterns (internal and external) can be found in corresponding device data sheets located on the WatchGuard website.
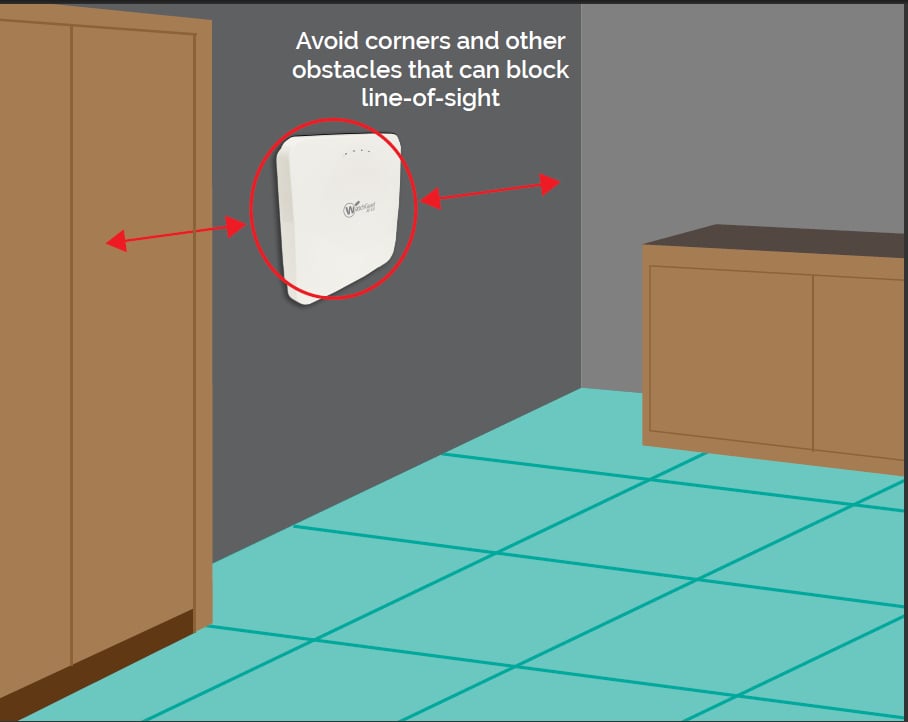
Wall Mount
While not as common as ceiling mounts, wall-mounted APs are also appropriate for most rooms. Wall-mounted APs can also be found in large rooms, such as auditoriums, where ceiling mounts are not practical because of ceiling height or accessibility. If you mount APs with a wall mount, consider the antenna radiation patterns, including back lobe patterns, of the AP model you deploy.
Ceiling Mount
Most wireless network deployments use ceiling mounts. When you mount APs to a ceiling, it is preferable to mount APs below the ceiling. Do not hide APs above a dropped ceiling for aesthetic or physical security purposes. The ceiling space can include metallic structures such as pipes or AC ducts that can attenuate RF transmissions.

Structural Proximity and Electrical Interference
These factors can affect the reliability and performance of the wireless network:
- Physical obstacles that can impede radio transmissions
- Radio frequency interference (RFI) from electronic devices and other radio sources
- Electromagnetic interference (EMI) from fluorescent bulbs, motors, and appliances
- Incorrect AP antenna placement
- Improper antenna selection
- Distances between access points and clients
AP Placement
For full wireless coverage and to make sure that all clients on your environment receive a strong wireless signal, consider these guidelines for the location and placement of your WatchGuard APs:
- Install your APs in a central location away from any corners, walls, or other physical obstructions to provide maximum signal coverage.
- Install your APs in a high location to provide the overall best signal strength reception and performance for your wireless network. In general, one AP can cover up to approximately 2000 square feet, with variation based on the physical environment and wireless interference.
- Make sure you do not install an AP near any electronic devices that can interfere with the signal, such as televisions, microwave ovens, cordless phones, air conditioners, fans, or any other type of equipment that can cause signal interference.
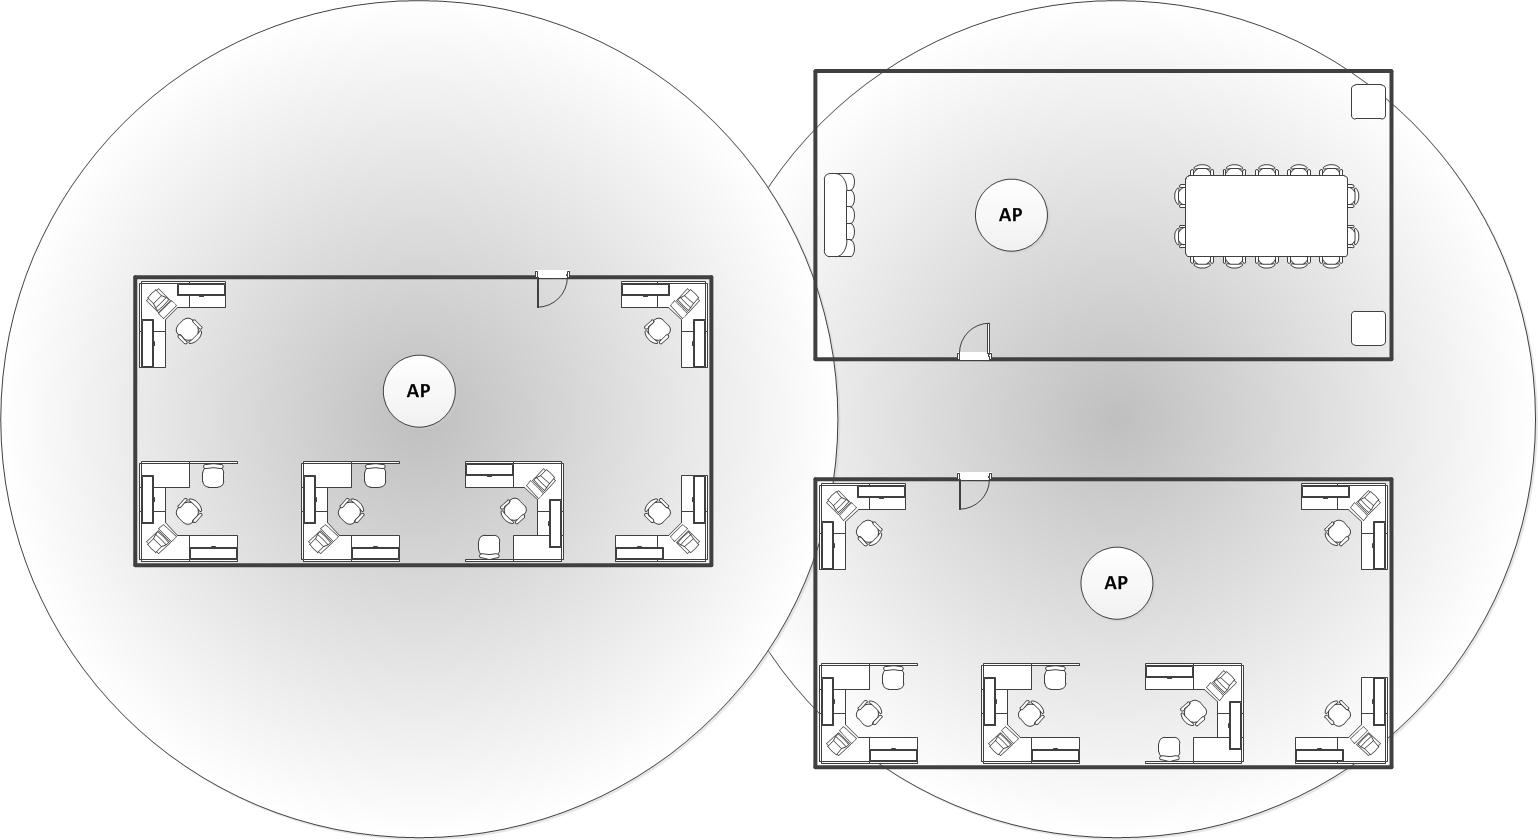
- When you install more than one AP, make sure to leave enough space between them to provide maximum coverage for your wireless network area of availability.
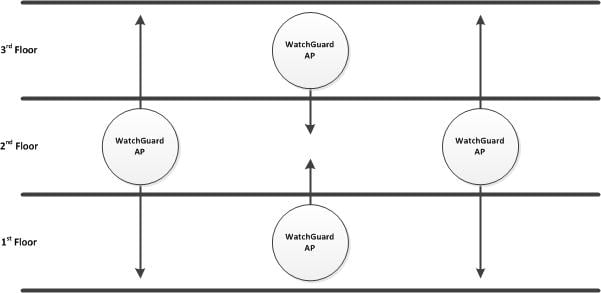
- For wireless coverage over many floors, you can stagger the placement of APs to cover both vertical and horizontal space.
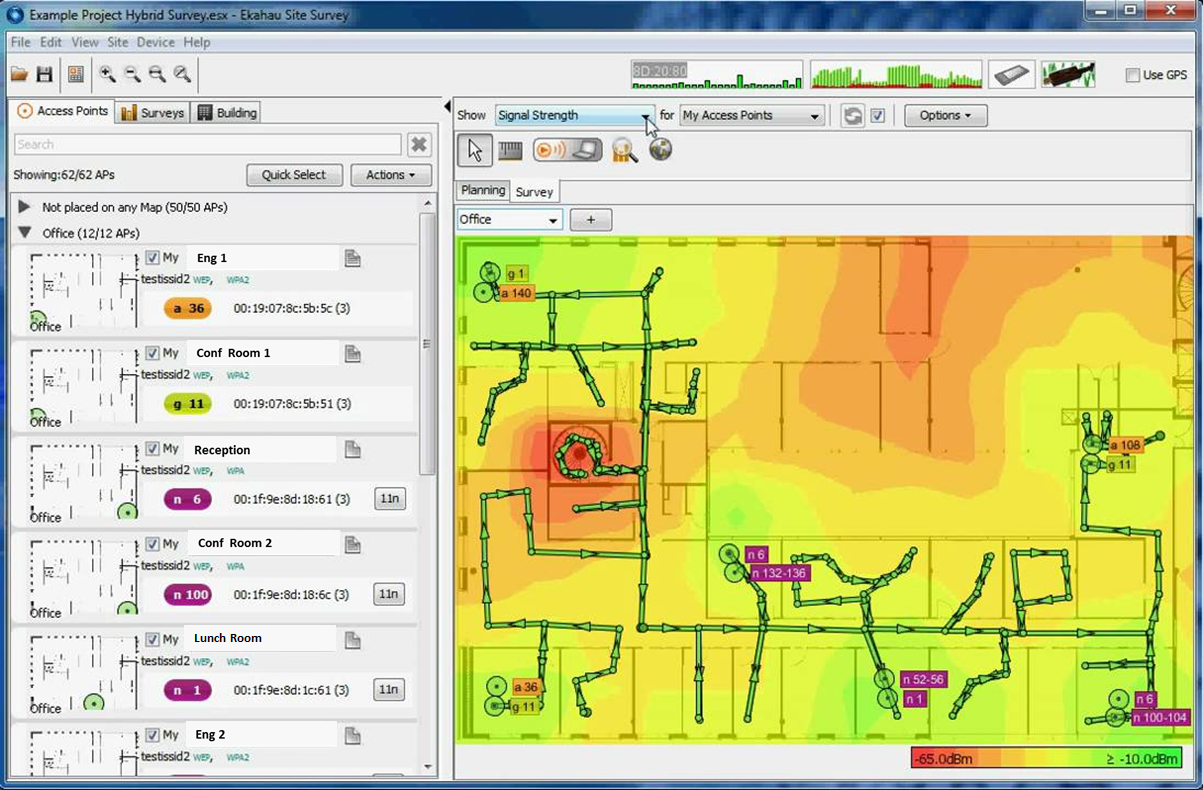
Post-Deployment Validation Survey
There are many post-deployment site survey tools available. The Ekahau Site Survey (ESS) is one of the most popular tools for this purpose. Like most site survey tools, ESS supports both passive and active site surveys. An active survey measures sent packets and received packets. This mode is used to determine metrics such as packet loss and packet delay. A passive survey listens to probes and beacons passively and is useful for creation of coverage and SNR (Signal to Noise Ratio) maps. ESS also supports a hybrid survey mode that simultaneously performs a passive and active survey. We recommend you use the hybrid mode.
These are guidelines for a post-deployment validation survey:
- If you use Ekahau, use Hybrid survey mode. Use Passive or Active mode if you use another tool
- Survey both the 2.4 GHz and 5 GHz bands
- Disable Auto Channel (ACS/DCS)
- Remove all SSIDs from the client excluding the SSID you will survey
- Gather a sufficient number of data points (for example, 1 data point for every 10 to 20 feet)
- Perform the survey with doors closed
Summary of Recommendations for an AP Placement and Channel Plan
This table provides a summary of the recommendations for an AP placement and channel plan.
|
Recommendations |
Notes |
|---|---|
|
Use a predictive site survey application. |
The predictive site survey can automate the AP placement and channel capacity planning process. |
|
Consider 1-for-1 AP replacement. |
Only implement 1-for-1 replacement if conditions are true as outlined in the One-for-One AP Replacement section of this guide. |
|
SNR should be 25 dB or greater throughout the coverage area.
|
|
|
Minimum RSSI should be -62 dBm throughout the coverage area. |
If designing for 256 QAM rates everywhere the minimum RSSI should be -52 dBm (w/ 80MHz channels). |
|
Clients should see two to three APs (on different channels) at RSSI of -70 dBm or greater. |
|
|
Consider deploying one full-time WIPS sensor for every three to five APs. |
Depends on security requirements. |
|
Distance between two APs should be approximately 30 to 70 feet. |
|
|
Reduce AP transmit power. |
Classroom: 5 GHz: 8 to 16 dBm 2.4 GHz: 4 to 10 dBm
Auditorium or Lecture Hall: 5 GHz: 5 to 12 dBm 2.4 GHz: 3 to 10 dBm |
|
APs may be ceiling or wall-mounted. |
Consider back lobe radiation of antenna when you use a wall mount. |
|
Disable 2.4 GHz radios on a percentage of APs. |
Percentage of APs with disabled 2.4 GHz radios depends on how many unique 5 GHz channels are in use. The more 5 GHz channels in use the greater the % of APs that should have there 2.4Ghz radios disabled. |
|
AP placement and channel plan should use channels to minimize CCI and ACI. |
|
|
Stagger APs across floors. |
|
|
Consider directional antennas for very high client density deployments. |
|
|
For high ceilings (higher than 30 feet / 9.14 meters), high gain (6-9 dB) patch antennas are recommended. |
|
|
Adjust AP output power in relation to antenna gain. |
|
|
Know the antenna radiation patterns and focus gain towards clients. |
|
|
Do not place APs near lighting fixtures or conductive material. |
|
|
Do not place APs above ceiling tiles. |
|
|
Perform a thorough post -deployment site survey. |
|