Applies To: Wi-Fi Cloud-managed Access Points (AP125, AP225W, AP325, AP327X, AP420)
Analyze provides two graphs that display the data transfer by days and by location. To view these graphs, select Analytics > Wi-Fi Usage.
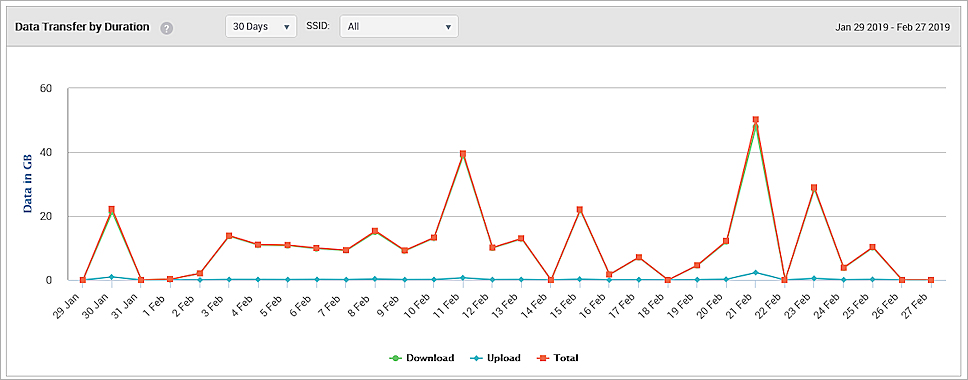
- Data Transfer by Duration — A line graph that plots the data received transmitted and total data exchange over the specified duration at the selected location.
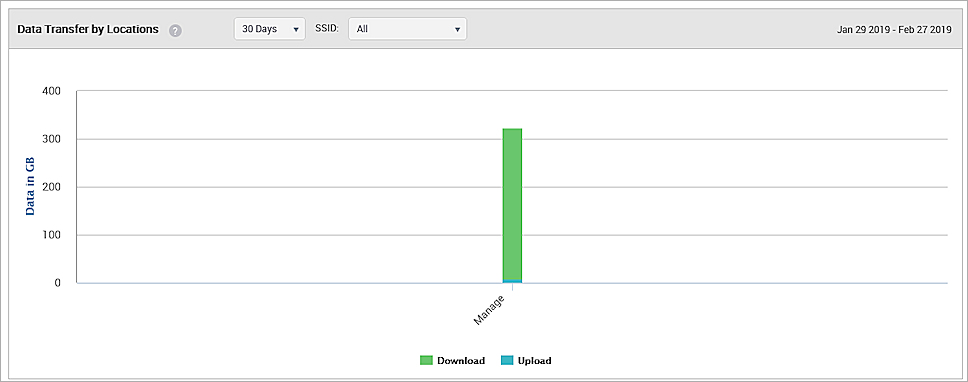
- Data Transfer by Locations — A bar graph that plots the data transmitted and received for the specified duration at the selected location and its immediate child locations for the specified SSID. When you select a particular location from the Locations tree, the chart depicts the total Wi-Fi usage for that location including its sub-folders. The chart indicates data transferred from the AP to the client (download) and from the client to the AP (upload). Aggregated data for the location is shown.