Applies To: Wi-Fi Cloud-managed Access Points (AP120, AP125, AP225W, AP320, AP322, AP325, AP327X, AP420)
You can view the AP-based visitor distribution and dwell time for a location floor from Analytics > Floor Map based on the proximity of visitors to the APs deployed on the location floor.
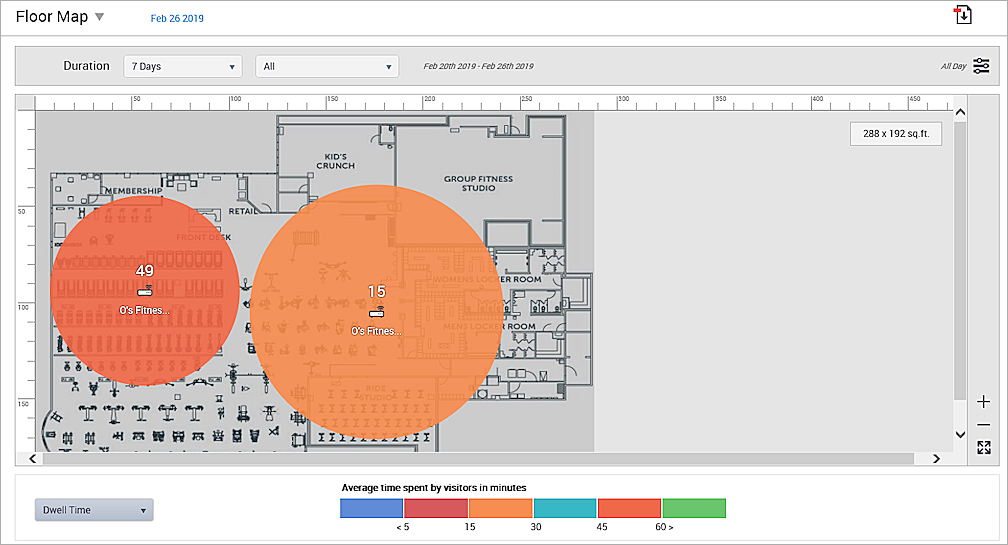
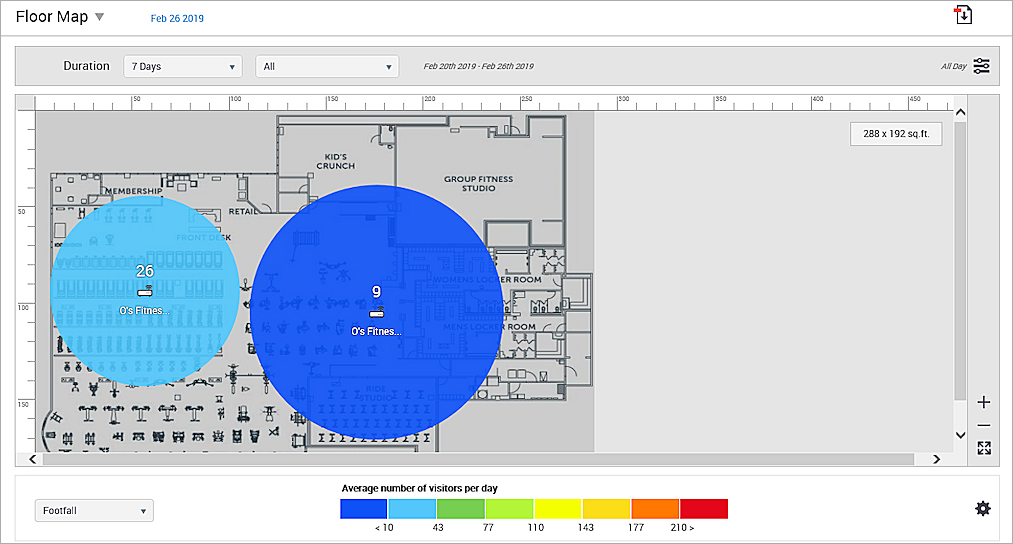
The graphical view on the Floor Map page displays the average number of visitors visible to the AP on the floor for the selected time period or the average dwell time per AP for the selected time period. The zone for each AP is represented by a circle. You can reduce or extend the zone by dragging the edge of the circle with the mouse. You cannot extend an AP zone beyond a signal strength of -90 dBm.
The floor map for the selected location floor is retrieved from Wi-Fi Cloud.
When you click an AP on the floor map, the device MAC address, radius of the AP zone, and total visitors are displayed. If the AP has been present for only a part of the selected duration, a start date and end date is also displayed with these details.
Each client is counted based on the unique MAC addresses of the device and the total visit time is calculated for a particular date, time slot, sensor, and RSSI value. The range of the MAC address and time is examined for unique visits. Based on the RSSI values, the range is then created. For example, if a range for -40 dBm is created, when you increase the range of the RSSI value to -50 dBm or more, the number of clients change.
Analyze provides you with these AP-based visitor analytic views for a location floor:
- Footfall by AP — This graphical representation shows the average number of visitors visible to the AP in the selected interval for the specified time period at the selected location floor. By default, the interval is "all day". For visitor distribution or footfall, you can configure the minimum and maximum number of visitors per day for the average visitors view. Visibility is based on the density of users who are using Wi-Fi. The visitors who can connect at a particular location are presented as aggregate data as the footfall for the AP.
- Dwell Time by AP — This graphical representation shows the average time spent by visitors in the AP zone in the selected interval for the specified time period at the selected location floor. By default, the interval is "all day". The dwell time indicates the amount of time a guest user spends at a particular location near an AP. This indicates where the guest user spends the most amount of their time while connected. When you choose a 7 day duration and a visitor visits each day at that particular location, they will be counted as one unique visitor on each day. If you choose a larger time frame such as >90 days, the visitor is then counted as one user. The data is aggregated so the data for a user is not counted as a single user each time.