Applies To: Wi-Fi Cloud-managed Access Points (AP125, AP225W, AP325, AP327X, AP420)
You can view the day and location-based visitor distribution and visitor dwell time graphs from the Presence page on the Analytics tab.
These visitor analytic graphs are available:
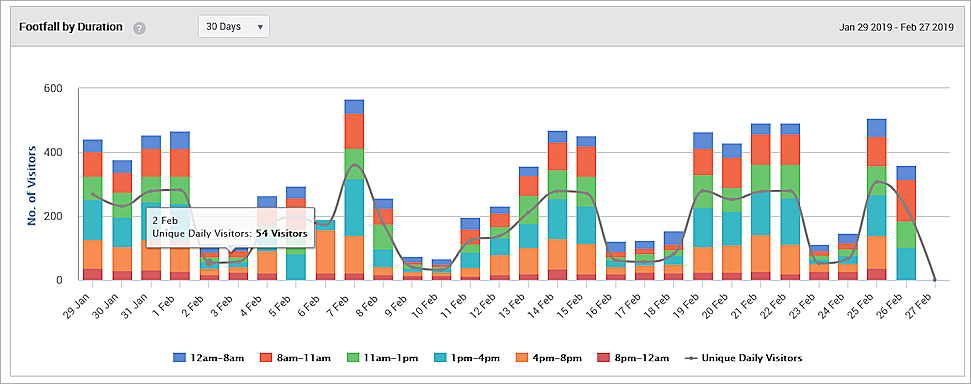
- Footfall by Duration — A bar graph that shows the number of visitors during different times of a day for the specified duration and at the selected location. The graph also plots the total number of visitors for each day at the selected location for the specified duration. The data also includes guest users who were visible by the AP but did not connect to Wi-Fi.
The data displayed on the graph for each time is based on the time zone set for the location selected in the tree. The graph plots the total number of visitors for each day (based on the duration selected). The graph also plots the total number of visitors during a specific time period of the day (time splice). The total number of visitors for a specific time splice is calculated by aggregating the visitor count during the said time splice for each location, based on the time zone of the location.
Visitors is the total number of unique devices that visited your location. Visits are an aggregate count of unique devices that visited your location and the count of repeat visits for the same location. For example, if you have two devices in range of a WatchGuard AP at two different times within the same day, the Visitors count will be 2, but the Visits will be counted as 4 in total. Similarly, if a guest user logs in through different devices in the same time slot or a different time slot, they will be counted as a different visitor each time as the login is based on the MAC address of the device. Different MAC addresses will count as different visitors.
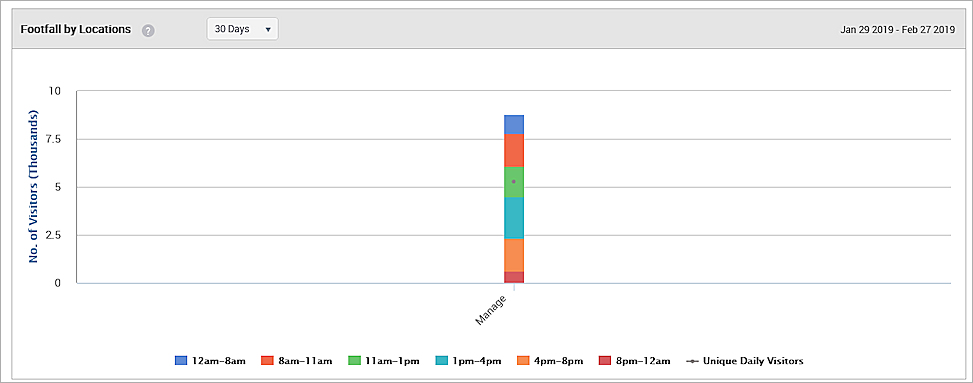
- Footfall by Locations — A location-based bar graph that shows the total number of visitors during different time periods of the day aggregated for the specified duration. The data is plotted for the selected location and its immediate child locations.
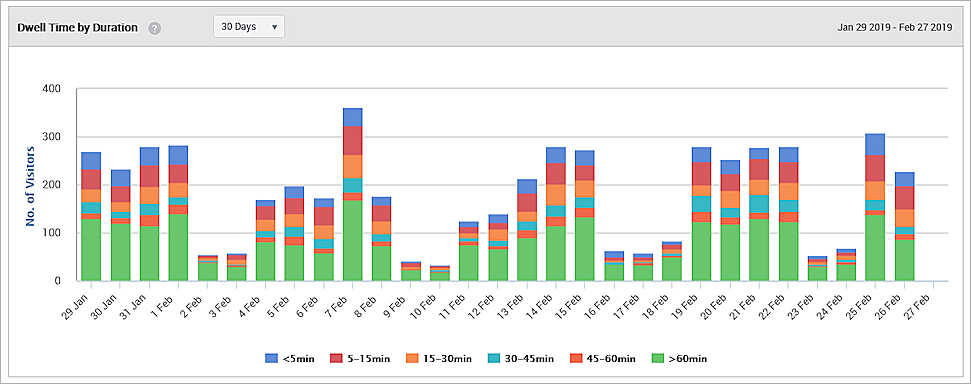
- Dwell Time by Duration — A bar graph that shows the total number of users who have accessed Wi-Fi for different time periods during each visit for the specified duration at the selected location. The Dwell time depends on the RSSI values received about the clients. When a client connects to Wi-Fi for a particular time slot, the duration is tracked as aggregate data for time slot. For example, if during a time slot of 8-11AM, a client logs in at 8-9AM for 4 minutes and again logs in from 9-10AM for 3 minutes, the total time slot will be 7 minutes and this will be indicated on the chart.
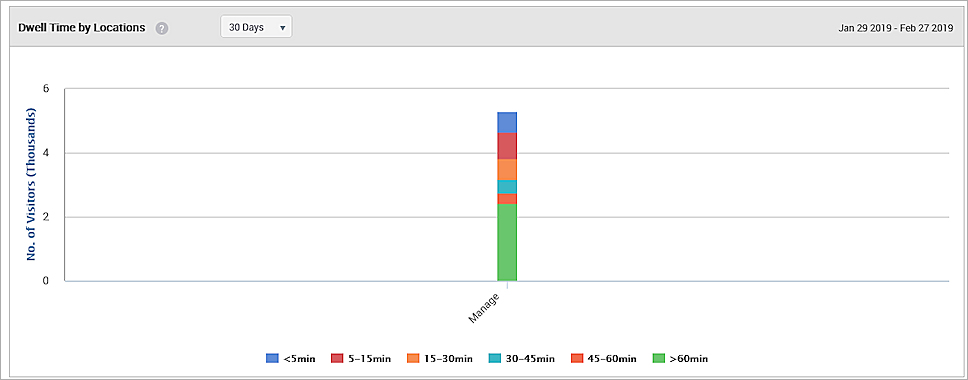
- Dwell Time by Locations — A location-based bar graph that shows the total number of users who have accessed Wi-Fi for different time periods during each visit. The data is aggregated for the specified duration. The data is plotted for the selected location and its immediate child locations. These values depend on the aggregated detected RSSI values of the client to determine the correct location.