Applies To: ThreatSync+ NDR
This feature is only available to participants in the ThreatSync+ NDR Beta program.
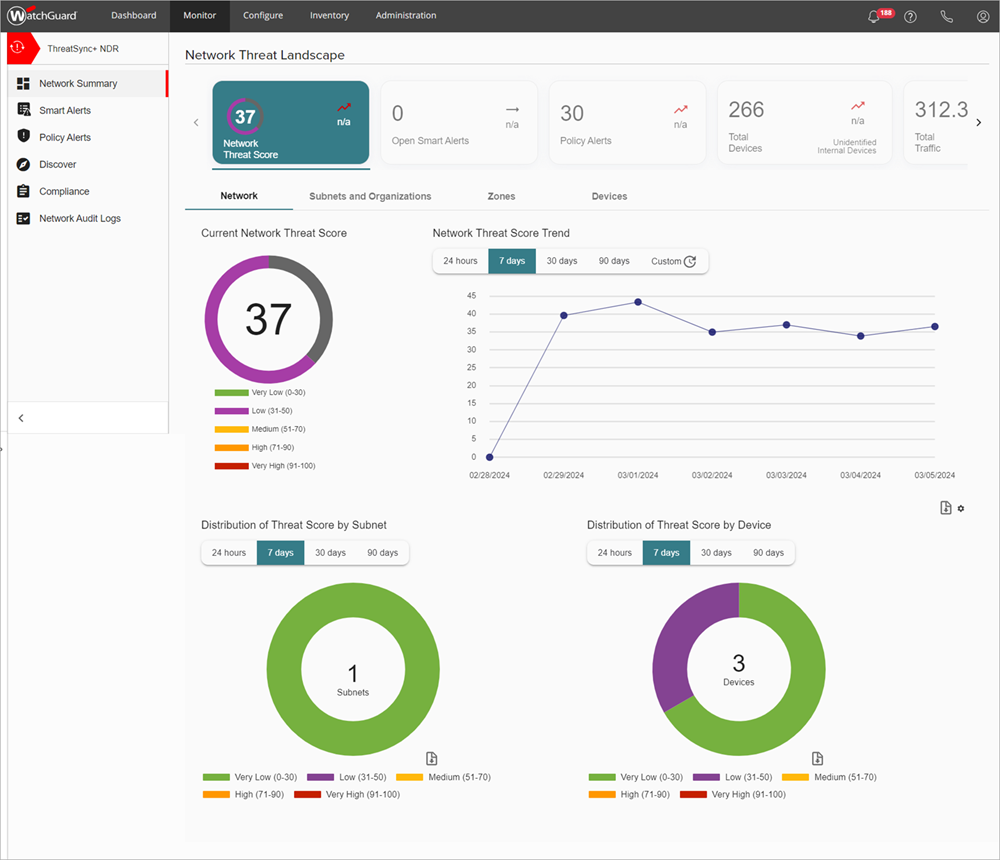
The Network Summary page opens by default when you select Monitor > ThreatSync+ NDR. This page provides an overview of trends in your network and includes links to detailed information about Smart Alerts, policy alerts, device risks, and network traffic.
For more information about the Summary page, go to these sections:
Network Threat Score
ThreatSync+ NDR delivers actionable intelligence in the form of a network threat score, which aggregates threat scores for internal nodes, subnets and zones. You can see the current threat score in the Network Threat Score widget.

ThreatSync+ NDR calculates two types of threat scores:
- IP address or Device Threat Score — ThreatSync+ NDR uses advanced analytics to calculate a threat score for every internal IP address in your network. Parameters used in this calculation include Smart Alerts, policy alerts, and behaviors and events that involve the node. This score updates every 30 minutes to provide a measure of the threats and vulnerabilities detected by ThreatSync+ NDR.
- Group Threat Score — A group can be a subnet (internal organization) in your network, an internal zone (all critical devices), or your entire network. ThreatSync+ NDR aggregates the node scores to show a metric for your entire network as well as for each of the subnet organizations you configure.
ThreatSync+ NDR uses the threat score categories:
- Very High — 91-100
- High — 71-90
- Medium — 51-70
- Low — 31-50
- Very Low — 0-30
The Network Threat Score widget includes several charts and counters:
- Current Network Threat Score
- Network Threat Score Trend
- Distribution of Threat Score by Subnet
- Distribution of Threat Score by Device
Subnets and Organizations
The Subnets and Organizations tab in the Network Threat Score widget shows an aggravated threat score for each internal organization. An internal organization is a collection of internal IP address ranges that represent one or more subnets or ranges of IP addresses. For more information, go to Configure Subnets and Organizations.

The Subnets and Organizations tab shows these details:
- Threat Score
- Trend
- Organization Name
- Active IP Addresses
- Recent Active Devices
- Threat Score Trend
Zones
The Zones tab shows the aggregated threat score for each zone. A zone is a group of network devices. For more information, go to Manage ThreatSync+ NDR Zones.

The Zones tab shows these details:
- Threat Score
- Trend
- Type
- Name
- Description
- Members
- Recent Active Devices
- Threat Score Trend
Devices
The Devices tab shows the aggregated threat score for every device that is active on your network.
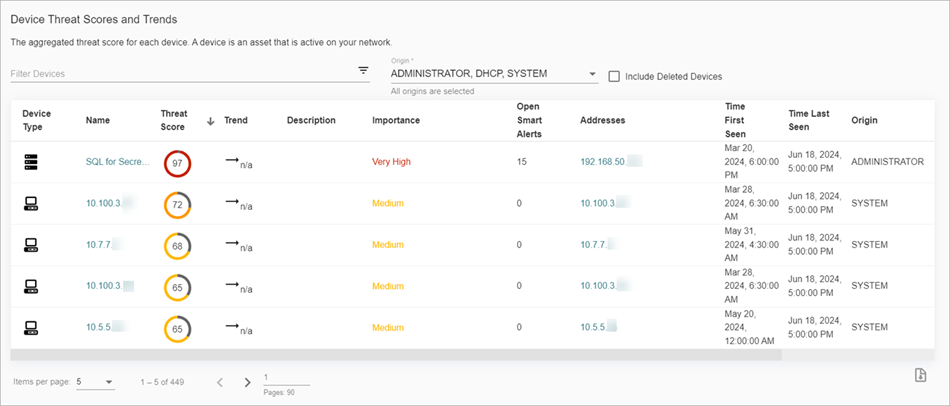
The Devices tab shows these details:
- Device Type
- Name
- Threat Score
- Trend
- Description
- Importance
- Open Smart Alerts
- IP Addresses
- Time First Seen
- Time Last Seen
- Origin
- Operating System (OS)
Open Smart Alerts
The Open Smart Alerts widget shows a list of open Smart Alerts, and two charts that show different views of Smart Alert details.
Open Smart Alerts Over Time
The Open Smart Alerts Over Time chart shows a count of open Smart Alerts for a specified time period.

You can view open alerts for these time periods:
- 24 hours
- 7 days
- 30 days
- 90 days
The default time period is 7 days.
Smart Alerts by Major Actor and Type
The Smart Alerts by Major Actor and Type chart shows a count of Smart Alert types by major actor for a specified time period. A major actor is the device that is associated with malicious activity. The major actor can be the device that is responsible for the threat, or it might be the compromised device that an attacker uses to carry out the malicious behavior.

Policy Alerts
The Policy Alerts widget shows a list of detected policy violations. A policy alert indicates that a device violated a specific policy. For more information, go to About Policy Alerts.

Four charts are available on the Policy Alerts widget:
- Policy Alerts by Tag
- Most Common Policy Types
- Policy Alerts Over Time
- Policy Alerts by Device or IP
Click a chart to view more details about the policy alert. For more information, go to About Policy Alerts.
Total Devices
The Total Devices widget shows a summary of device activity for all devices in the network.

Monitoring your network devices for unusual activity can help you identify potential security threats and vulnerabilities.
Four charts provide visibility into device activity and show these device summary details:
- Devices Over Time — The number of devices on your network over a specified time period.
- Recent Unidentified Private Devices — An interactive chart that shows a list of unidentified private devices detected on your network. Click an IP address to view more details about the device activity.
- Top Blocklist IP Addresses — The most commonly detected IP addresses on the blocklist over a specified time period.
- Most Active Source Addresses — The source IP addresses with the highest packet count over a specified time period.
To view detailed information about a specific device, click an IP address in the Recent Unidentified Private Devices section.
Total Traffic
The Total Traffic widget shows several charts and counters about network traffic and events over time.
The Activity by Source Device table shows what version of Fireware your Fireboxes are running, and whether the version is supported by ThreatSync+ NDR.
ThreatSync+ NDR requires Fireware v12.10.3 or higher.
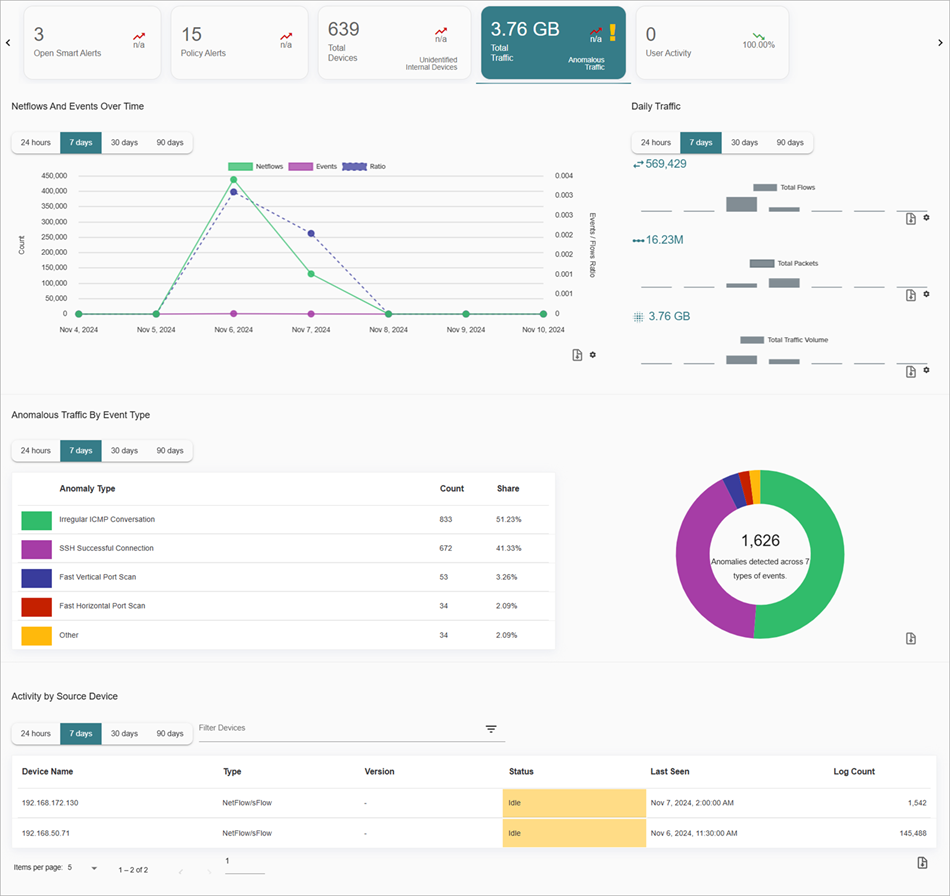
For more information about how to monitor traffic, go to Investigate ThreatSync+ NDR Traffic.
Download Charts
To download a chart, click ![]() next to the chart.
next to the chart.