Applies To: WatchGuard Cloud-managed Access Points (AP130, AP230W, AP330, AP332CR, AP430CR, AP432)
In this section, you determine where to place the access points and the wireless channels to use in your deployment.
- About Wireless Signal Strength and Noise Levels
- Predictive Site Survey
- Access Point Mounting Best Practices
- Channel Selection and Planning for 2.4 GHz and 5 GHz
About Wireless Signal Strength and Noise Levels
To make sure that all users in your environment receive a strong wireless signal, consider these guidelines when you install your WatchGuard access points.
Signal Strength
The signal strength is the wireless signal power level received by the wireless client.
- Strong signal strength results in more reliable connections and higher speeds.
- Signal strength is represented in dBm format (0 to -100). This is the power ratio in decibels (dB) of the measured power referenced to one milliwatt.
- The closer the value is to 0, the stronger the signal. For example, -41 dBm is a stronger signal than -61 dBm.
Noise Level
The noise level indicates the amount of background noise in your environment.
- If the noise level is too high, it can degrade the strength and performance of your wireless signal.
- Noise level is measured in dBm format (0 to -100). This is the power ratio in decibels (dB) of the measured power referenced to one milliwatt.
- The closer the value to 0, the greater the noise level.
- Negative values indicate less background noise. For example, -96 dBm is a lower noise level than -20 dBm.
Signal to Noise Ratio
The signal-to-noise ratio (SNR) is the ratio between the signal strength and the noise level.
- This value is represented in decibels (dB).
- In general, your signal-to-noise ratio should be +25 dB or higher. Values lower than +25 dB result in poor performance and speeds.
For example:
- If you have a -41 dBm signal strength, and a -50 dBm noise level, this results in a poor signal-to-noise ratio of +9 dB.
- If you have a -41 dBm signal strength, and a -96 dBm noise level, this results in an excellent signal-to-noise ratio of +55 dB.
RF Interference
Interference caused by Wi-Fi or non-Wi-Fi devices can greatly reduce performance of wireless networks. To optimize the performance of your wireless network you must be able to identify, locate and avoid sources of interference. To help you to identify sources of interference, you can perform a spectrum analysis during the pre-installation and post-deployment phases .
Wi-Fi Interference Sources
- Personal hotspots
- Malfunctioning clients
- Poorly designed wireless network or misconfiguration
- Neighborhood access points and clients external to your network
Non-Wi-Fi Interference Sources
- Video game controllers
- Microwave ovens
- Security cameras
- ZigBee devices
- Cordless phones
- Bluetooth devices
Predictive Site Survey
Use a predictive site survey software application to develop an access point placement plan to estimate coverage and capacity. You can use a predictive site survey planning application to generate a recommended access point placement and channel plan, including coverage, signal-to-noise ratio, and interference information to help with your deployment.
You must provide input on these factors for correct capacity planning:
- Specify client types and quantity (currently in use and anticipated growth)
- Specify applications (currently in use and anticipated growth) and streaming media requirements
- Design for capacity and coverage
- Use high-quality floor maps
- Specify a precise scale for the floor plan
- Consider possible RF leaks between floors
WatchGuard provides to partners a Wi-Fi Customer Requirements Questionnaire to assist in creating predictive site surveys. For more information, log in to your partner account on the WatchGuard web site and go to Product > Selling Secure Wi-Fi.
For more information, go to WatchGuard Wireless Site Survey.
Indoor Attenuation Reference
To make sure you have an accurate predictive site survey, measure the actual attenuation values for obstructions within the deployment site. You can use these attenuation values in your site survey. To measure attenuation values, you must use an access point and a smart phone with an application such as WiFi Analyzer.
To perform the measurement, check the signal level detected by the client when the client and access point are 5 meters apart with a clear line of sight (LoS). Then, check the signal level again at the same distance with the obstruction between the access point and the smart phone.
The difference between the LoS (line of sight) reading and the second reading is the measure of attenuation level for the obstruction. The attenuation values you obtain can improve the accuracy of your predictive site survey.
Example measurements:
- At 5 Meters line of sight = -54 dBm
- At 5 Meters behind obstruction = -57 dBm
- Obstruction Attenuation = 3 dB (A 3 dB loss is 50% signal loss)

This table shows the estimated values of attenuation for common materials found in typical deployments. Note the variability in attenuation for a specific type of material (for example, concrete and brick wall +/- 10 dB). Precise attenuation values produce a more accurate predictive site survey.
|
Attenuation Estimations |
||
|---|---|---|
|
|
Estimated Attenuation in 2.4 GHz |
Estimated Attenuation in 5 GHz |
|
Steel door |
16 dB (+/- 3 dB) |
28 dB (+/- 3 dB) |
|
Concrete or brick wall |
12 dB (+/- 6 dB) |
20 dB (+/- 10 dB) |
|
Coated or double-pane glass |
12 dB (+/- 1 dB) |
20 dB (+/- 1 dB) |
|
Cubicle wall |
4 dB (+/- 1 dB) |
6 dB (+/- 2 dB) |
|
Wood door |
4 dB (+/- 1 dB) |
6 dB (+/- 1 dB) |
|
Glass or window (not tinted) |
3 dB (+/- 1 dB) |
7 dB (+/- 1 dB) |
|
Drywall (interior) |
3 dB (+/- 1 dB) |
4 dB (+/- 1 dB) |
|
Ceiling tiles, curtains, blinds |
1 dB (+/- .5 dB) |
2 dB (+/- 1 dB) |
Rule of 10s and 3s
You can increase or decrease power due to several factors such as antenna gain and attenuation loss due to distance between access points and clients
- If you lose -3 dB, you lose 1/2 your original power
- If you gain +3 dB, you gain 2x your original power
- If you lose -10 dB, this is 1/10 your original power
- If you gain +10dB, you have 10x your original power
Access Point Mounting Best Practices
WatchGuard access points for indoor use are usually mounted on walls or ceilings. Outdoor access points are usually mounted on walls or poles.
- More information about mounting options are provided in the WatchGuard Access Point Hardware Guides.
- Information about WatchGuard access point antenna radiation patterns (internal and external) can be found in corresponding device data sheets located on the WatchGuard website.
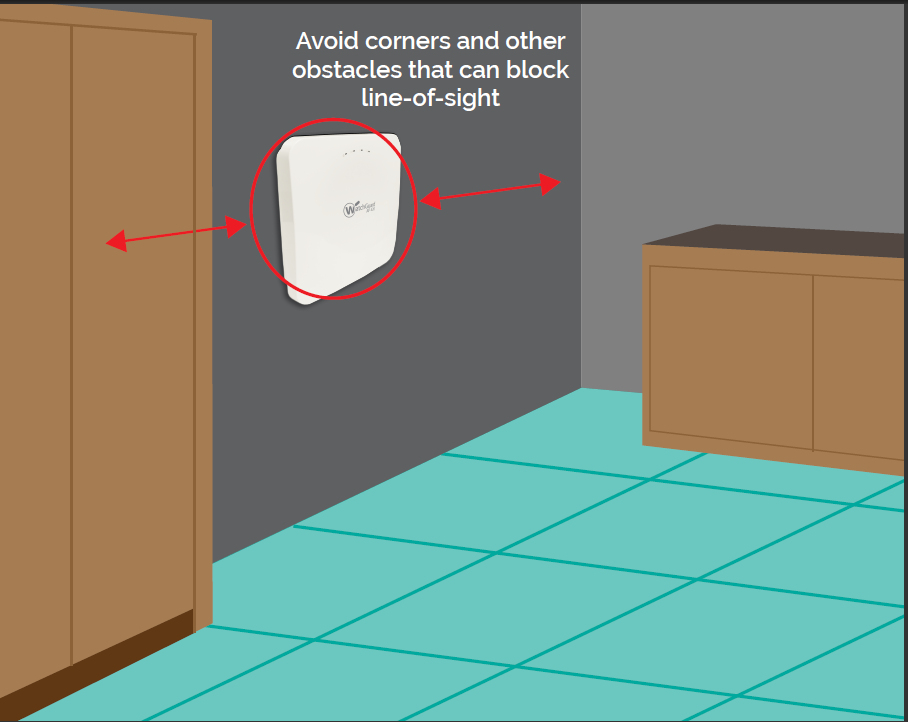
Wall Mount
While not as common as ceiling mounts, wall-mounted access points are also appropriate for most rooms. Wall-mounted access points can also be found in large rooms, such as auditoriums, where ceiling mounts are not practical because of ceiling height or accessibility. If you mount access points with a wall mount, consider the antenna radiation patterns, including back lobe patterns, of the device model you deploy.
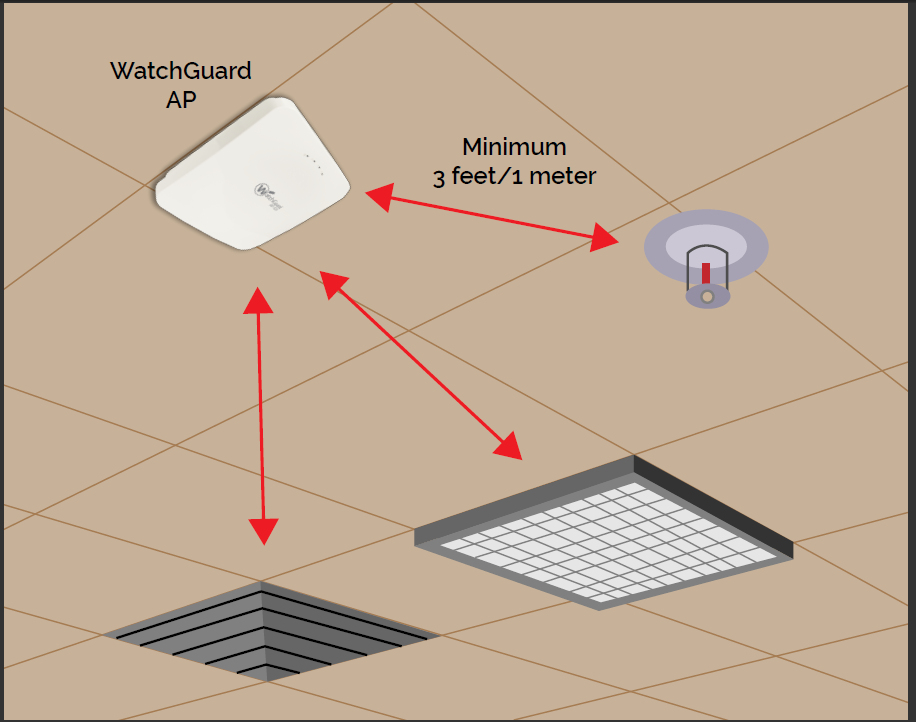
Ceiling Mount
Most wireless network deployments use ceiling mounts. When you mount access points to a ceiling, it is preferable to mount access points below the ceiling. Do not hide access points above a dropped ceiling for aesthetic or physical security purposes. The ceiling space can include metallic structures such as pipes or ducts that can attenuate RF transmissions.
Structural Proximity and Electrical Interference
These factors can affect the reliability and performance of the wireless network:
- Physical obstacles that can impede radio transmissions
- Radio frequency interference (RFI) from electronic devices and other radio sources
- Electromagnetic interference (EMI) from fluorescent bulbs, motors, and appliances
- Incorrect access point antenna placement
- Improper antenna selection
- Distances between access points and clients
Access Point Placement
For full wireless coverage and to make sure that all clients on your environment receive a strong wireless signal, consider these guidelines for the location and placement of your WatchGuard access points:
- Install your access points in a central location away from any corners, walls, or other physical obstructions to provide maximum signal coverage.

- Install your access points in a high location to provide the overall best signal strength reception and performance for your wireless network. In general, one access point can cover up to approximately 2000 square feet, with variation based on the physical environment and wireless interference.
- Make sure you do not install an access point near any electronic devices that can interfere with the signal, such as televisions, microwave ovens, cordless phones, air conditioners, fans, or any other type of equipment that can cause signal interference.
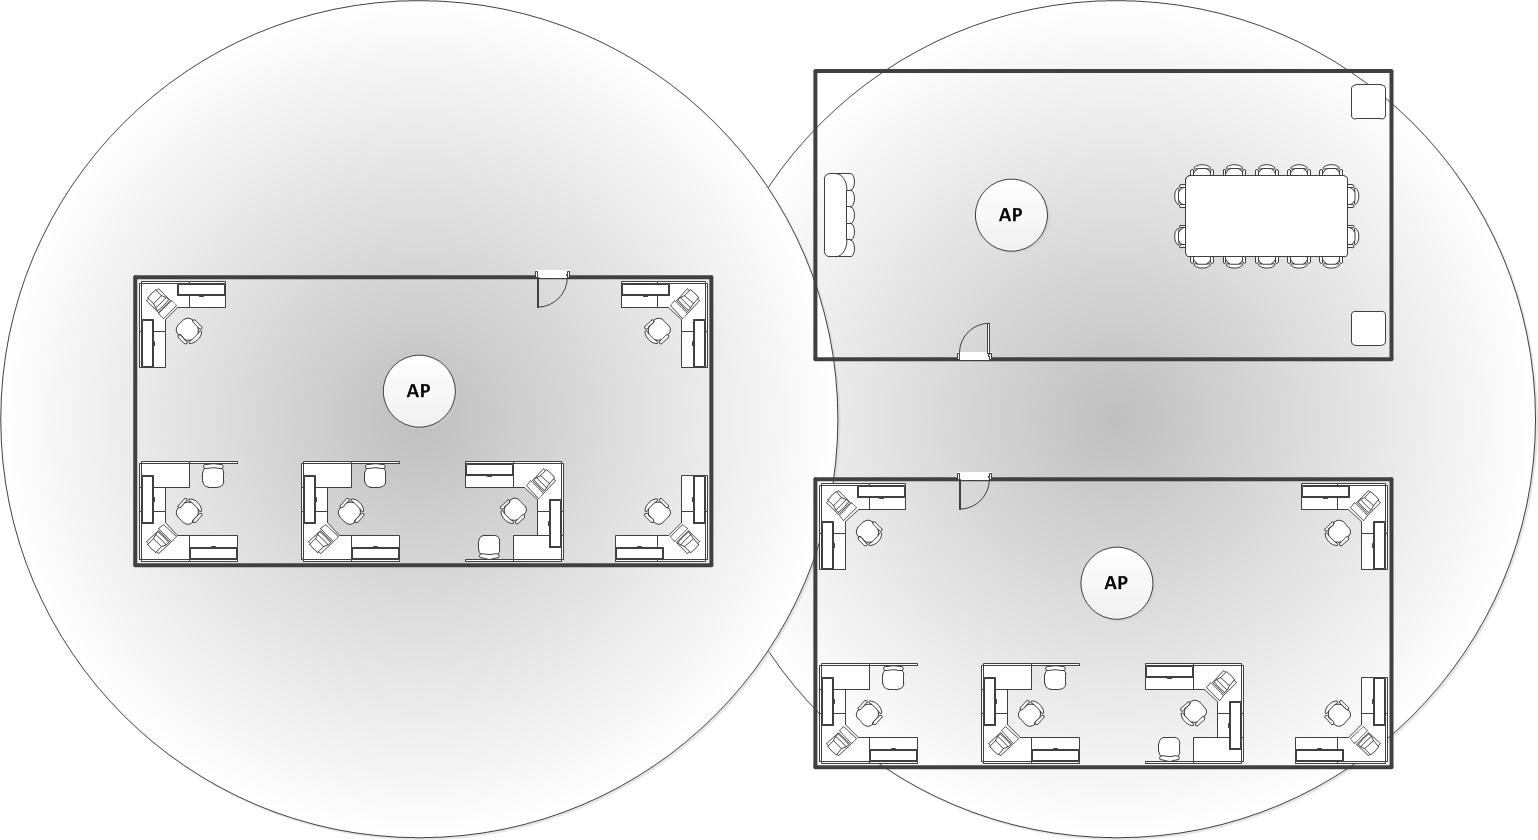
- When you install more than one access point, make sure to leave enough space between them to provide maximum coverage for your wireless network area of availability.
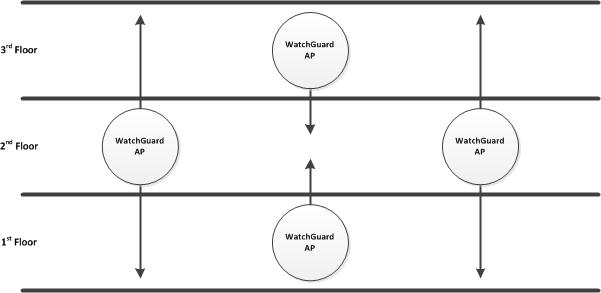
- For wireless coverage over many floors, you can stagger the placement of access points to cover both vertical and horizontal space.

Channel Selection and Planning for 2.4 GHz and 5 GHz
By default, the preferred channel is set to Auto. In this mode, the access point automatically selects a quiet channel with the least interference from the available channels in the selected band. You can specify the specific channels available from the Candidate Channels selection list. Access Point Placement and Channel Plan Best Practices is also enabled by default that scans the network at regular intervals (default is every 12 hours) to find a channel with the least interference.
For complex or high-density deployments, you might need to use manual channel selection to minimize co-channel interference and contention, and maximize throughput.
Create a channel plan so that adjacent APs do not use the same frequencies. This minimizes co-channel interference because APs do not use the same channel.
- In the United States and many other regions for the 5 GHz band, there are only 4 non-overlapping 40 MHz channels available if you do not use DFS channels, and 12 non-overlapping channels if you use DFS channels.
- There are 2 non-overlapping 80 MHz channels available if you do not use DFS channels, and 6 non-overlapping channels if you use DFS channels.
- In the 2.4 GHz band, only channels 1, 6, and 11 are non-overlapping channels.
Even if DFS channels are not used, 5 GHz channels outnumber 2.4 GHz channels by a wide margin. This means that if both 5 Ghz and 2.4 GHz radios are active on all access points in a network designed for capacity, there is a high probability that the access pints could create harmful co-channel interference (CCI) in the 2.4 GHz band.
Another factor is that 2.4 GHz frequencies provide greater coverage range than 5 GHz frequencies. To minimize the amount of self-induced CCI in the 2.4 GHz band, we recommend you disable 2.4 GHz radios on some of the deployed access points.
Channel Plan Examples
This is an example of a 5 GHz channel plan for a wing of a school building. For best performance, 12 access points are deployed to increase density.

This is an example of a 2.4 GHz channel plan for the same wing of a school building. The three non-overlapping channels are reused throughout the wing without interference. To reduce co-channel interference, only 7 of the 12 access points have the 2.4 GHz radio enabled.
