You can monitor the active processes for the Dimension Database, review diagnostic log messages for the database, and view the database Status Report.
To review the Dimension database diagnostics:
- Select

 > Administration > Administration > Database.
The Database pages open. - Select the Diagnostics tab.
Database Process List
In the Process List, you can see all the active Dimension database processes. The process list includes these details:
- PID — The process ID number.
- Name — The name of the process.
- CPU — The sum of the percentage of the bandwidth that the PostreSQL processes currently use on the available CPU cores. Because each CPU core can run at 100%, and the PostreSQL processes use both CPU cores, the maximum is 200%.
- Memory — The amount of memory on the Dimension system that the process currently uses.
- Create Time — The date and time that the process started.
- Command Line — The command line path to the process.
To refresh the process list, click ![]() .
.
View the Database Log Messages
The Dimension database generates a log file each day of the log messages from that day. In the Log Messages section, you can view the log messages.
- From the Select Log File drop-down list, select a log file.
The log messages from the selected log file appear. - To refresh the Log Messages list, adjacent to the Select Log File drop-down list, click
 .
. - To change the number of lines of log messages that appear in the list, in the Number of log messages to show text box, type or select the number of lines and click .
- To refresh the log messages in the list, click .
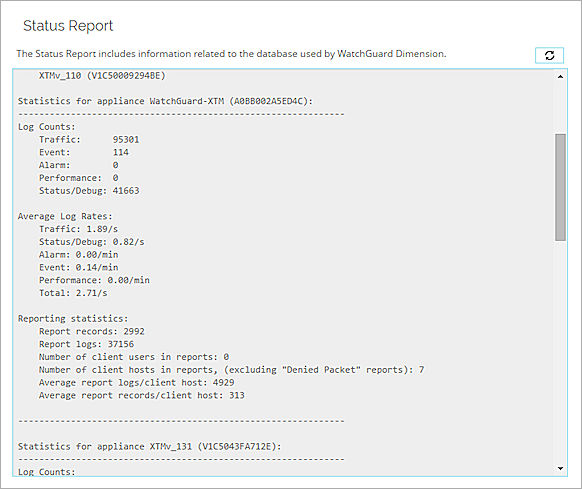
View the Status Report
The Dimension Status Report includes statistics for the Log Server database, as well as log message and report statistics for the devices that are connected to Dimension. Log message data appears in UTC time for the current day. Statistics include the log message counts and log rates, number or records kept in the database, also the size of the Dimension server log message table for the day. You can use the information from the Status Report to help you determine if the size of your Dimension database is sufficient to meet your log data storage requirements.
- To see the database information and device statistics, use the scroll bar.
- To refresh the report details, click .