In dimension, on the Subscription Services Dashboard page for your Firebox, you can see a high-level view of all the Subscription Services that are enabled on your Firebox for the date and time range you select.
A separate widget appears on the Subscription Services page for each Subscription Service that is enabled on your Firebox, and that has traffic for the selected date and time range.
Widgets include:
Blocked Websites
Includes the total number of HTTP requests and traffic that is denied by WebBlocker.
Virus (GAV)
Includes the total amount of traffic that was scanned, and the total number of viruses that were detected by Gateway AntiVirus.
Intrusions (IPS)
Includes the total amount of traffic that was scanned, and the total number of intrusions detected and prevented by the Intrusion Prevention Service.
Malware (APT)
Includes the total amount of traffic that was scanned, the total amount of advanced malware detected, the total amount of zero-day malware that was detected, and the total amount of content quarantined by APT Blocker.
Reputation Enabled Defense
Includes the total amount of traffic that was scanned, and the amount of good, bad, and inconclusive reputation score statistics for URLs that were scanned by Reputation Enabled Defense (RED).
Data Loss Violations (DLP)
Includes the total amount of traffic that was scanned, the amount of traffic denied for violations, and the amount of blocked and quarantined content that was scanned by Data Loss Prevention.
spam
Includes the total amount of traffic that was scanned, the amount of traffic that was denied for violations, and the amount of clean, confirmed spam, bulk, and suspected spam mail that was identified by spamBlocker. (Bulk and Suspect categories are supported by Fireware v12.1.3 and lower, and Fireware v12.2.x to Fireware v12.5.3.)
Botnet Detection
Includes the total amount of traffic scanned, the total amount of traffic denied for violations, and the total amount of source and destinations that were scanned and blocked by Botnet Detection.
The Subscription Services Dashboard only appears if you have licensed and configured Subscription Services on your Firebox and if your Firebox has generated log messages for the configured Subscription Services.
To see the Subscription Services Dashboard:
- From the Devices page List, Health, or License tabs, select the name of a Firebox with connected Subscription Services enabled.
If the Firebox has only a logging connection to Dimension, the Executive Dashboard page opens.
If the Firebox has a management connection to Dimension, the Device Summary page opens. - From the Start and End drop-down list calendars, select the start and end dates to include in the report data, then click Apply.
The data in the Executive Dashboard changes based on the time range you specify. - From the Tools tab, expand the Dashboards list and select Subscription Services.
The Subscription Services page opens, with a separate widget for each configured Subscription Service with log message data.
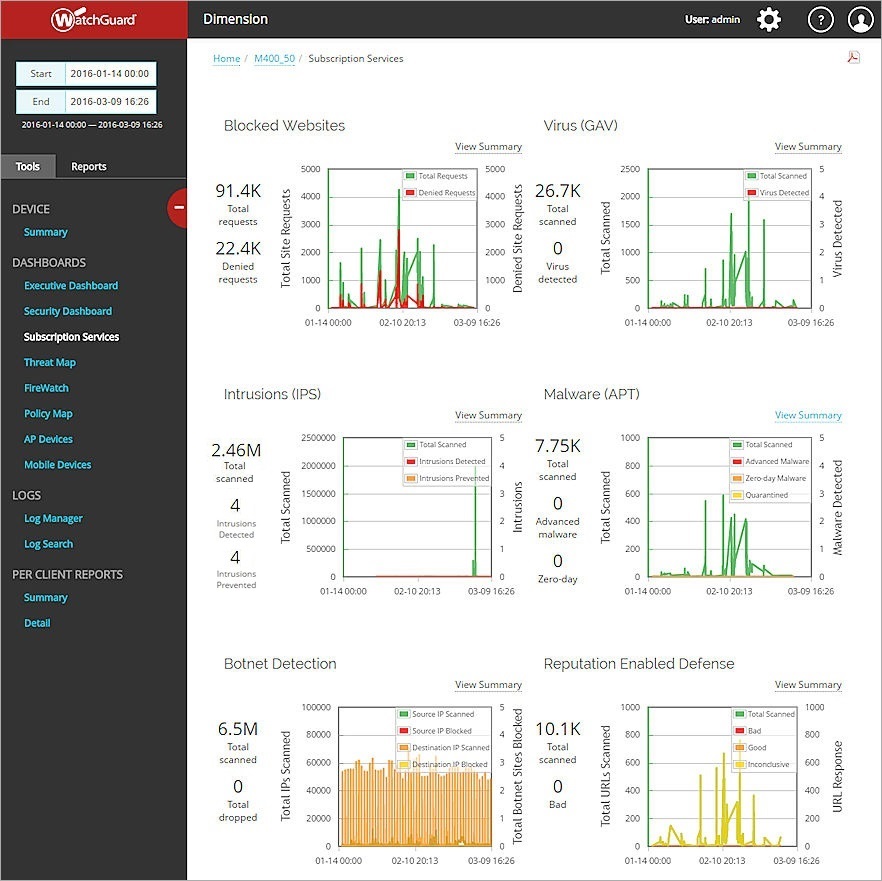
Example of the Subscription Services page.
Each widget includes a graph of the data for the selected time range for that Subscription Service and a summary of the statistical values for that service at the left side of the graph. The graphs show the total amount of data scanned in green, and other statistics in red, orange, and yellow.
To see the summary report of the data available for each Subscription Services widget, click View Summary.
You can also generate a .PDF file of the Subscription Services Dashboard page. At the top-right of the page, click ![]() .
.