Applies To: Locally-managed Fireboxes
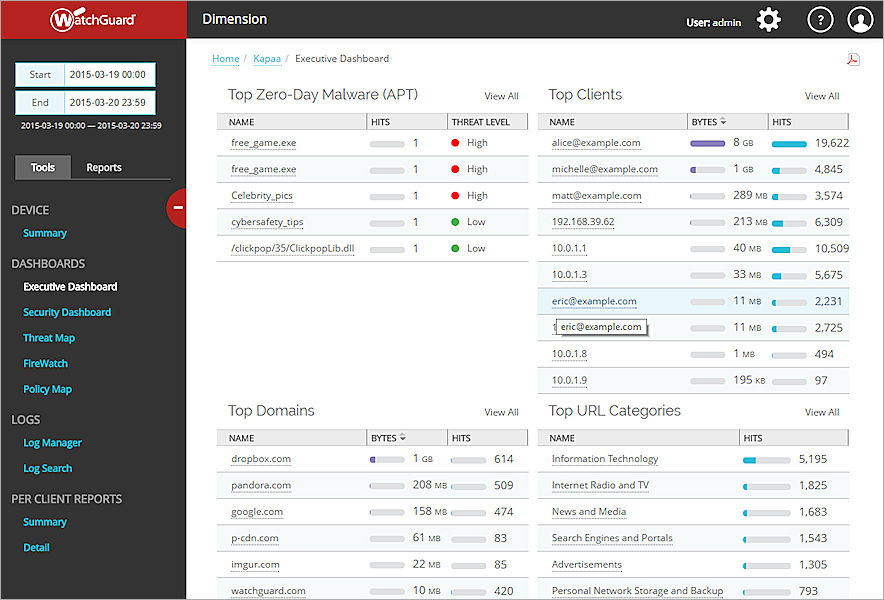
In Dimension, on the Executive Dashboard page for any Firebox, FireCluster, or group, you can see high-level view of the traffic through the selected Firebox, cluster, or group. You can also add IP addresses and domains to the Blocked Sites List from the Executive Dashboard.
The Executive Dashboard includes the top threats in these categories:
- Top Zero-Day Malware (APT)
- Top Clients
- Top Domains
- Top URL Categories
- Top Destinations
- Top Applications
- Top Application Categories
- Top Mobile Devices
- Top Protocols
Each of these categories only appears if there is data available in that category.
To see the data in the Executive Dashboard:
- Select Home > Devices or Home > Groups.
The Devices or Groups page opens. - Select a Firebox or group in the list.
If the Firebox or group has only a logging connection to Dimension, the Executive Dashboard page opens.
If the Firebox or group has a management connection to Dimension, the Device Summary page opens. - If the Device Summary page appears, select Executive Dashboard.
- From the Start and End drop-down list calendars, select the start and end dates to include in the report data, then click Apply.
The data in the Executive Dashboard changes based on the time range you specify.
- To see more information about any of the top details that appear in a category, click the link in the Name column.
The report data is refined based on your selection.
For the Top Clients, Top Destinations, and Top Domains categories, the detail dialog box appears when you click the link in the Name column. Click the Filter on link to see more details about that site. - To expand a category to see all of the details in that category, click the category header.
For example, to see a list of all client activity, click the Top Clients header.
The category expands to show all available items. - To see all data for the a category, adjacent to the category section, click View All.
- To generate a PDF summary report of the Executive Dashboard, click
 and select a location to save the PDF file.
Block a Site
From the Executive Dashboard page, you can add an IP address or domain name to the Blocked Sites List for any site included in these sections:
- Top Clients — IP address
- Top Destinations — IP address or domain name
- Top Domains — Domain name
To block a site:
- In the Top Clients, Top Destination or Top Domains section, click the IP address or domain name of a site.
The detail dialog box opens for the selected site.
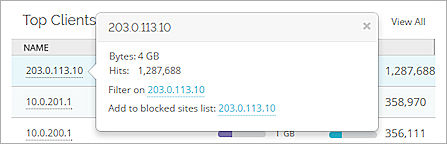
- Adjacent to Add to blocked sites list, click the address link.
The Add to Blocked Sites dialog box opens with all of the options completed. - (Optional) Modify any of the settings as necessary.
- Click OK.
The site is added to the Blocked Sites list.
From the Executive Dashboard page, you can open Fireware Web UI for application items that appear in the Application and Application Control categories. When you click the link to open the Web UI, the page in the Web UI where you can modify the settings to allow or deny the traffic appears.
To open Fireware Web UI:
- From the Executive Dashboard page, click the application name in the Application or Application Control categories.
The detail dialog box opens for the selected application traffic. - Adjacent to Open Fireware Web UI, click the link.
The related page in Fireware Web UI opens. - Modify the configuration of the selected feature as necessary.