Applies To: WatchGuard Advanced Reporting Tool
The Security Incidents dashboard shows security status and the incidents detected on the network. It includes information to help you determine the source of threats and the impact on your organization.
The Security Incidents dashboard shows:
- Malware, exploits, potentially unwanted programs (PUPs), and anomalous processes detected, and their execution status
- Endpoints with the most infection attempts and detected malware
Your operator role determines what you can see and do in WatchGuard Cloud. Your role must have the Access Advanced Security Information permission to view or configure this feature. For more information, go to Manage WatchGuard Cloud Operators and Roles.
To open the Security Incidents dashboard, from the WatchGuard Endpoint Security management UI:
- In WatchGuard Cloud, select Monitor > Endpoint Security.
- Select Status.
- From left pane, select Advanced Visualization Tool.
A new browser tab opens. - From the left pane, select Advanced Reporting > Security Incidents.
- Select a time period to filter the data on.

- Click Refresh.
The dashboard shows information for the time period selected.
There are two tabs in the Security Incidents dashboard:
Key Security Indicators
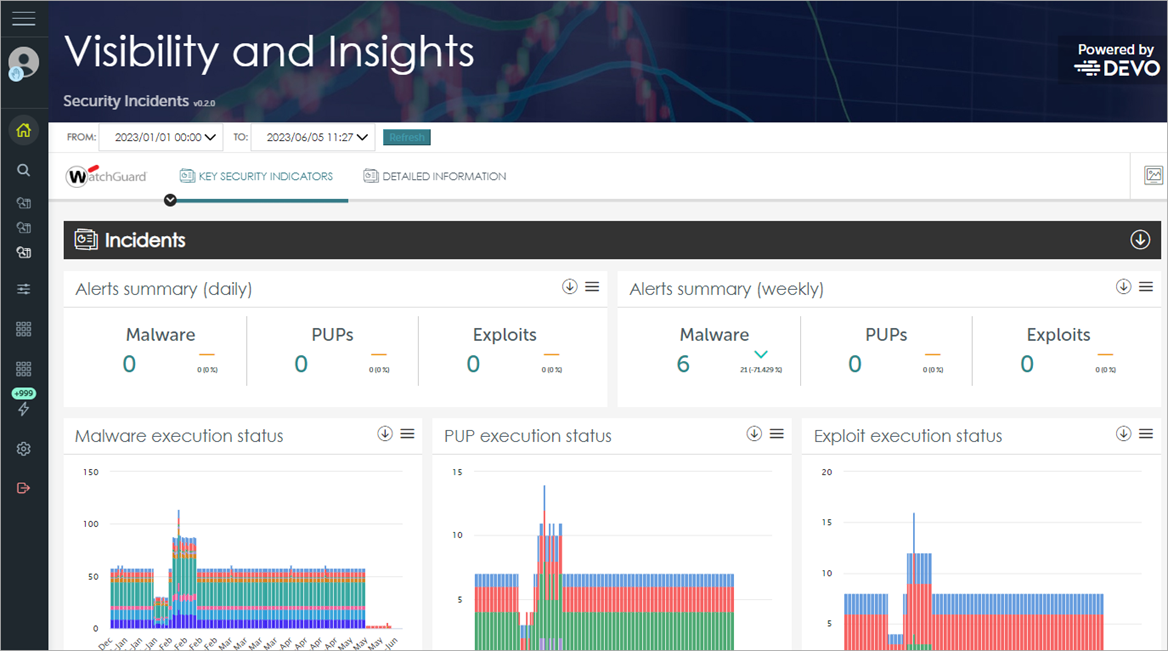
The Key Security Indicators tab provides an overview of malware activity on your network. This includes the types of malware, potentially unwanted programs (PUPs), and exploits detected, the endpoints affected, and whether the malware executed successfully.
These tiles are available on the Key Security indicators tab:
Alerts Summary (Daily and Weekly)
The Alerts Summary tiles use arrows and percentages to show the variation in the number of detected incidents compared to the previous day (daily) and previous week (weekly).

Malware and PUPs — Show the incidents detected in processes run on user workstations and in their file systems. Both real-time scans and on-demand scans report these incidents.
Exploits — Shows the number of vulnerability exploit attacks against Windows computers on the network.
Malware, PUP, Exploit Execution Status
Shows the evolution of malware detected on the network. You can review the number of malware detections on all network computers, grouped by day of the month.
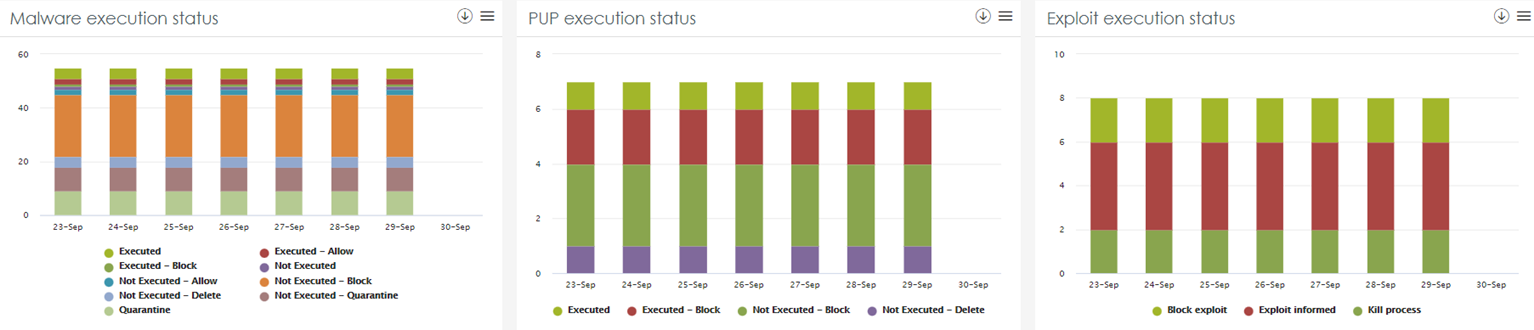
These tiles use color codes to indicate the days of the year when most malware detections occurred on the network. This enables you to identify days when your network had the most attacks and investigate the causes.
Calendar of Daily Malware Detections
Shows the evolution of detections of malware on the network. Shows the number of detections of malware on all network computers, grouped by day of the month.
Calendar of Daily Potential Unwanted Program (PUP) Detection
Shows the evolution of detections of Potential Unwanted Programs (PUP) on the network. Shows the number of detections of Potential Unwanted Programs (PUP) on all network computers, grouped by day of the month.
Calendar of Daily Exploit Detections
Shows the evolution of exploit-type threats found on the network. Shows the number of exploit detections on all computers on the network, grouped by day of the month.
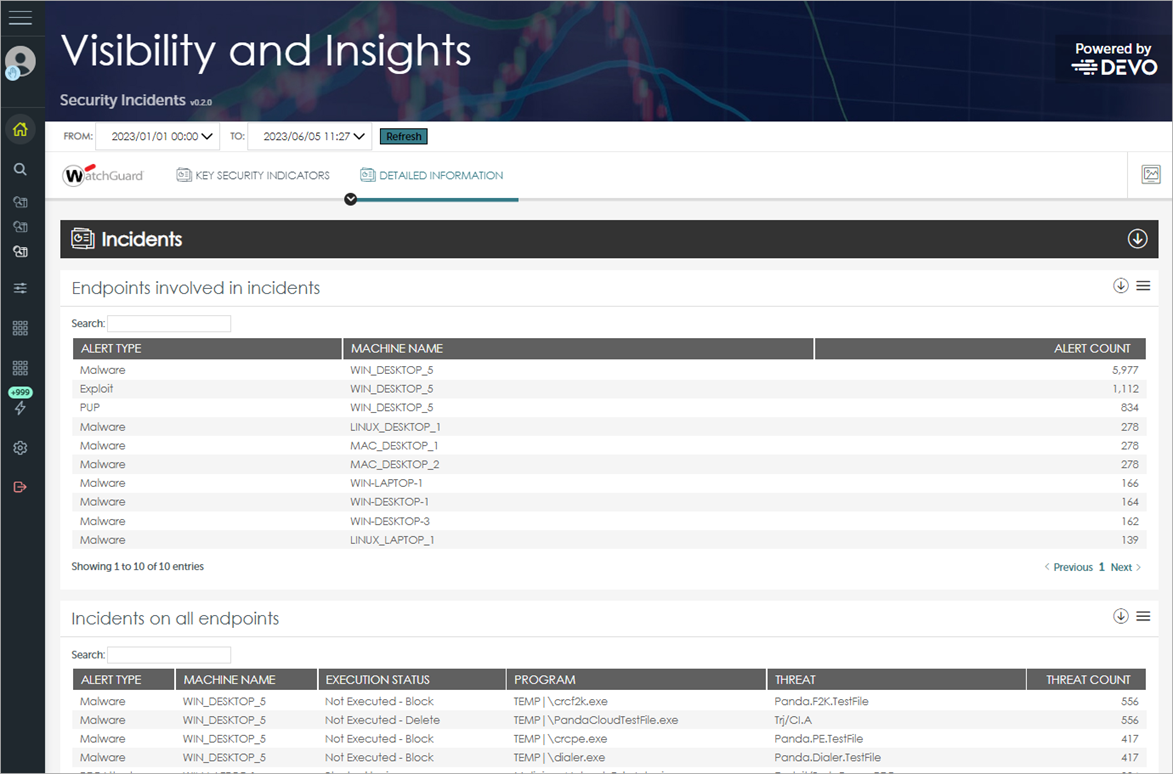
Detailed Information
On the Detailed Information tab, you can review information about the endpoints involved in a security incident.
These sections are available on the Detailed Information tab. To open a section, click ![]() .
.
Endpoints Involved in Incidents
Use the information in this table to help you locate the network computers with the most threats detected, and their type.
Incidents on All Endpoints
This table shows a complete list of all endpoints infected over the selected period.
Malware Per Endpoint Hourly
This table shows the number of malware detections in the last hour on each network computer.
Malware in the Network Hourly
This table shows the number of malware detections in the last hour on the whole network.
Malware Executed in Different Endpoints Hourly
This table shows the number of computers that executed a specific type of malware in the last hour.