Applies To: WatchGuard Advanced Reporting Tool
To reduce the risk of attack, and make it easier to manage and build policies to protect the operating system, we recommend that you minimize the number of different versions of Microsoft Windows in your IT environment.
The Install table logs all the information generated during the installation of the endpoint agents on customer computers. We can filter and refine the Install table to view the versions of Microsoft Windows that are in use, as well as how to generate a visual representation of the data.
Your operator role determines what you can see and do in WatchGuard Cloud. Your role must have the Access Advanced Security Information permission to view or configure this feature. For more information, go to Manage WatchGuard Cloud Operators and Roles.
To view the Microsoft operating systems in use, from the WatchGuard Endpoint Security management UI:
- In WatchGuard Cloud, select Monitor > Endpoint Security.
- Select Status.
- From the left pane, select Advanced Visualization Tool.
A new browser tab opens. - From the left pane, select Data Search.
- Select the oem.panda.paps.install table for the time period you want.
The data table window opens. For information on the fields available in the table, go to Fields Available in the Install Table.

- Filter the op column by Install and Upgrade.

- Filter the opPlatform column for platforms that start with Win.
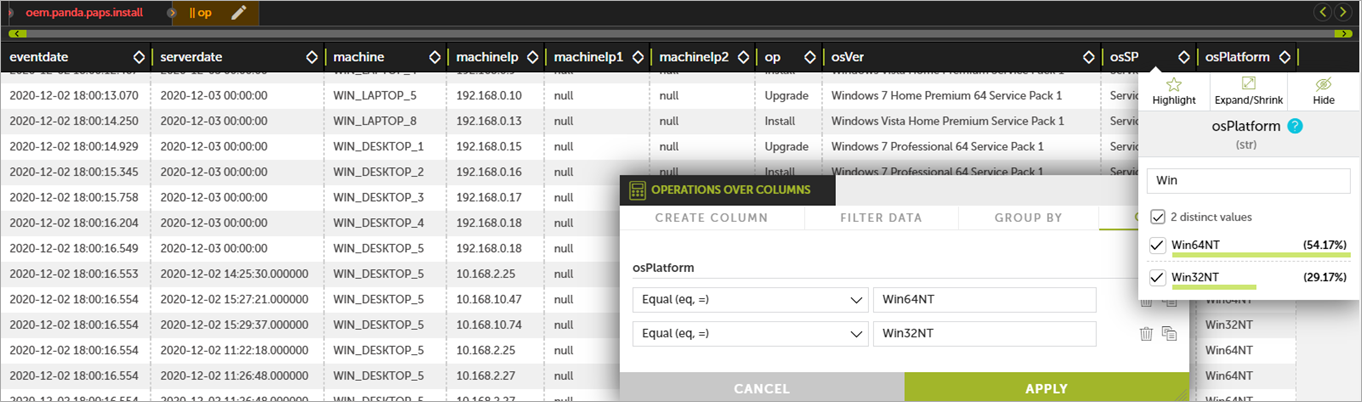
- Click Apply Filter.
- Select the osVer column and click Group in the toolbar.

- Click New Argument.
- From the Arguments list, select osVer.
- Click Group By.
- To create a count of the machines with each OS version, add a Count column:
- Click Add Column.
- Select Aggregate Function.
- In the Column name box, type count.
- From the Aggregation list, select Count.
- Click Aggregate Function.
- To create a chart of this data:
- Select Options > Charts > Plots > Histogram.
- Drag the osVer and Count columns from the data table in to the Histogram dialog box.
Fields Available in the Install Table
The Install table logs all the information generated during the installation of the endpoint agents on the customer computers. Each field can be used in a query to filter the data table.
| Field | Description | Values |
|---|---|---|
|
eventDate |
Date when the event was received on the Advanced Reporting Tool server. |
Date |
|
serverdate |
Date of the user computer when the event was generated. |
Date |
|
machine |
Name of the customer computer. |
String |
|
machineIP |
IP address of the customer computer. |
IP address |
|
machineIP1 |
IP address of an additional network card if installed. |
IP address |
|
machineIP2 |
IP address of an additional network card if installed. |
IP address |
|
op |
Operation performed. |
|
|
osVersion |
Operating system version. |
String |
|
osServicePack |
Service Pack version. |
String |
|
osPlatform |
Platform of the operating system installed:
|
Enumeration |