Applies To: Endpoint Security Elite, Endpoint Security 360, Endpoint Security Prime, WatchGuard EDR, WatchGuard EDR Core, Endpoint Security Basic
The Dashboard page appears by default when you open the WatchGuard Endpoint Security Plug-in for Kaseya VSA. The dashboard provides an overview of your customer accounts and enables you to see any threats at a glance. The dashboard indicates the number of computers and devices in the customer account, and shows counters of specific security incidents.
You can filter the data based on these time periods:
- Last 24 hours
- Last 7 days
- Last month
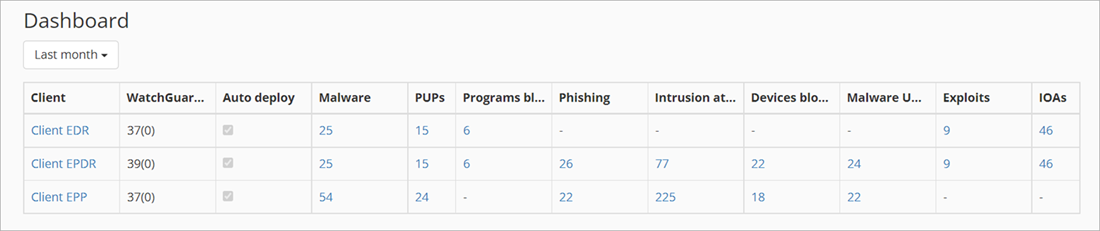
The Dashboard page shows these columns:
- Client — Shows the name of the client account. Click the client name to see more detailed information about the client and the devices in the account.
- WatchGuard Computers — Indicates the number of computers and devices in the client account.
- The first number indicates the number of computers and devices in the client account that have WatchGuard Endpoint Security products installed.
- The second number in parentheses indicates the total number of computers and devices that are registered in Kaseya VSA. This includes both devices that do and do not have WatchGuard Endpoint Security products installed.
The number of devices reported by Kaseya VSA and WatchGuard might differ because they use different discovery processes.
- Auto Deploy — Indicates if the client account is configured to automatically deploy WatchGuard Endpoint Security products on computers in the account. You can configure this option on the Clients page. For more information, see Map Kaseya VSA and WatchGuard Cloud Accounts.
- Malware — Indicates the number of incidents of malware on devices in the client account. Malware is software intended to damage the contents of a computer or allow unauthorized access.
- PUPs — Indicates the number of incidents of potentially unwanted programs (PUPs) on devices in the client account. PUPs can include unwanted programs installed by the end user or tools used by hackers to gain access to target computers.
- Programs Blocked — Indicates the number of incidents of blocked programs on devices in the client account.
- Phishing — Indicates the number of phishing incidents on devices in the client account. Phishing is a technique to obtain confidential information, such as user names and passwords or financial information, from end users.
- Intrusion attempts blocked — Indicates the number of intrusion attempts that were blocked on devices in the client account.
- Devices Blocked — Indicates the number of devices that were blocked in the client account. A device is blocked after an end user tries to use a restricted device.
- Malware URLs Blocked — Indicates the number of malware URLs that were blocked on devices in the client account. Malware URLs are web addresses of pages that contain malware.
- Exploits — Indicates the number of exploit attacks that tried to compromise trusted programs on devices in the client account.
- Indicators of Attack — Indicates the number of confirmed events detected that are highly likely to be an attack.
A hyphen (-) in a column indicates that security data is not applicable for the corresponding client.
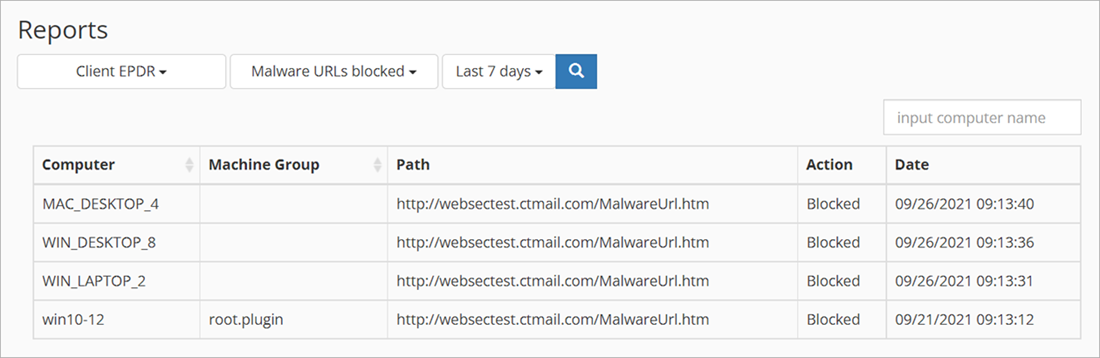
Select a specific counter to view the Reports page filtered for the selected client and threat. For example, if you click the malware counter for an Endpoint Security 360 client, the Reports page opens with Client Endpoint Security 360 selected and filtered for malware.