Deployment Overview
WatchGuard provides integration instructions to help our customers configure WatchGuard products to work with products created by other organizations. If you need more information or technical support about how to configure a third-party product, see the documentation and support resources for that product.
Integration Summary
The hardware and software used to complete the steps outlined in this document include:
- Plixer
- Scrutinizer v19.2.0-64053
- WatchGuard Firebox
- Installed with Fireware v12.8.1 or higher
Test Topology
This diagram shows a typical NetFlow topology.
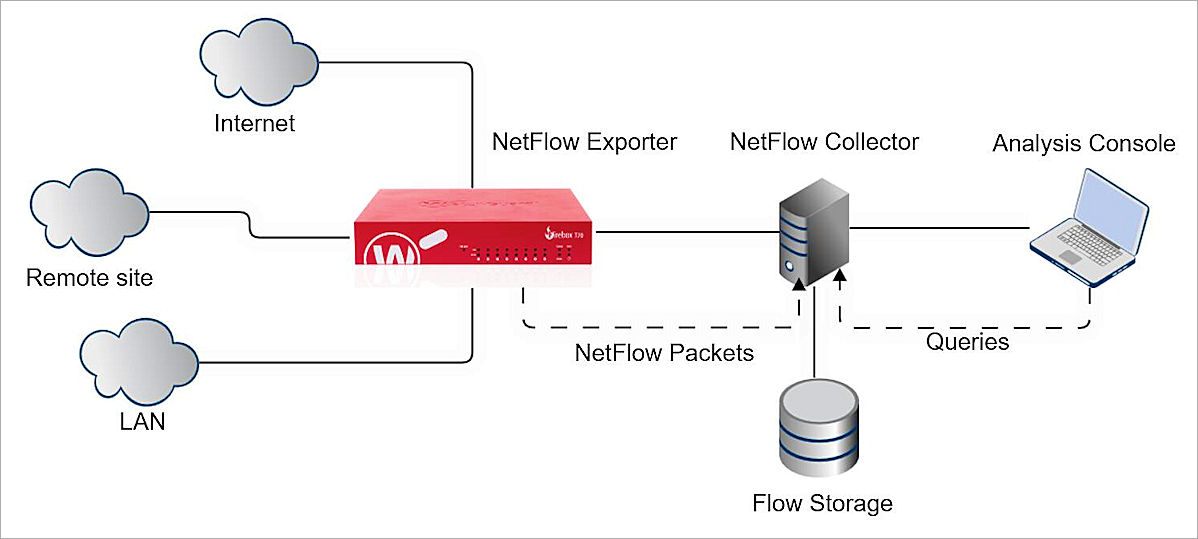
Plixer Scrutinizer is the NetFlow Collector and Flow Storage in this diagram.
Before You Begin
Make sure your Plixer Scrutinizer services are running and your Firebox has Fireware v12.8.1 or higher.
Configure Your Firebox for Plixer Scrutinizer
You must configure your Firebox as a NetFlow exporter and specify connection settings for the NetFlow collector.
To configure your Firebox as a NetFlow exporter, from Fireware Web UI:
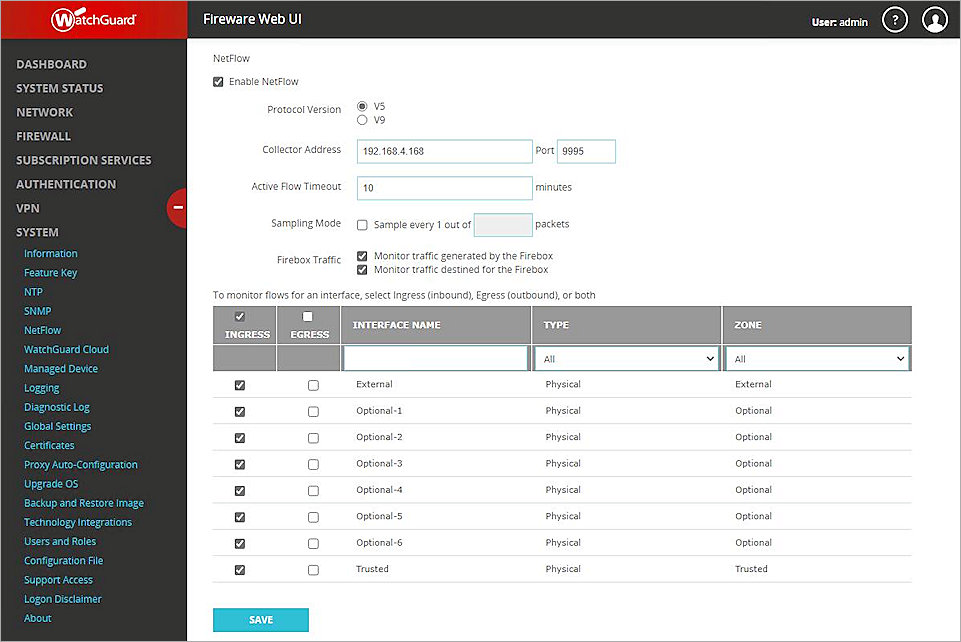
- Select System > NetFlow.
- Select Enable NetFlow .
- For the Protocol Version, select V5.
- In the Collector Address text box, type the IP address of the NetFlow collector (Plixer Scrutinizer).
- In the Port text box, type 9995.
You can also type 2055, 2056, 4432, 4739, 9996, or 6343, if you configured Plixer Scrutinizer to use one of these ports.
The Firebox must be able to communicate with the NetFlow collector at the specified IP address and port with the UDP protocol. If necessary, add the related firewall policy. For more information about NetFlow on the Firebox, see About NetFlow and Configure NetFlow in Fireware Help. - In the Active Flow Timeout text box, type 10.
The Active Flow Timeout setting segments your flow into small flows based on the value you specify. We recommend that you specify a Active Flow Timeout value that is lower than the Active Flow Timeout value on the collector. This helps to avoid data loss. If the Active Flow Timeout value is lower on the collector, the collector can stop listening while the Firebox is sending data. - Keep the Sampling Mode disabled.
- To monitor outbound traffic generated by the Firebox, select Monitor traffic generated by the Firebox and Monitor traffic destined for the Firebox.
- To enable NetFlow for an interface, select the check box adjacent to that interface.
If you have many interfaces, use the Interface Name search box or select an option from the Type or Zone drop-down lists to find an interface quickly. - To select all interfaces, select the check box adjacent to the Interface Name text box.
- Click Save.
For more information about NetFlow on the Firebox, see About NetFlow and Configure NetFlow in Fireware Help.
Verify the Plixer Scrutinizer Server Status
After you configure the Firebox, you must verify the status of your Plixer Scrutinizer servers.
To see the status of the Scrutinizer servers:
- Log in to your Plixer Scrutinizer web console with your administrator account.
- Make sure all the status icons for Scrutinizer servers are green.

Test the Integration
After you configure NetFlow on the Firebox, Plixer Scrutinizer shows data from the Firebox.
To see NetFlow information from the Firebox, in Plixer Scrutinizer:
- Login to Plixer Scrutinizer Web UI at https://IP address/ui/login
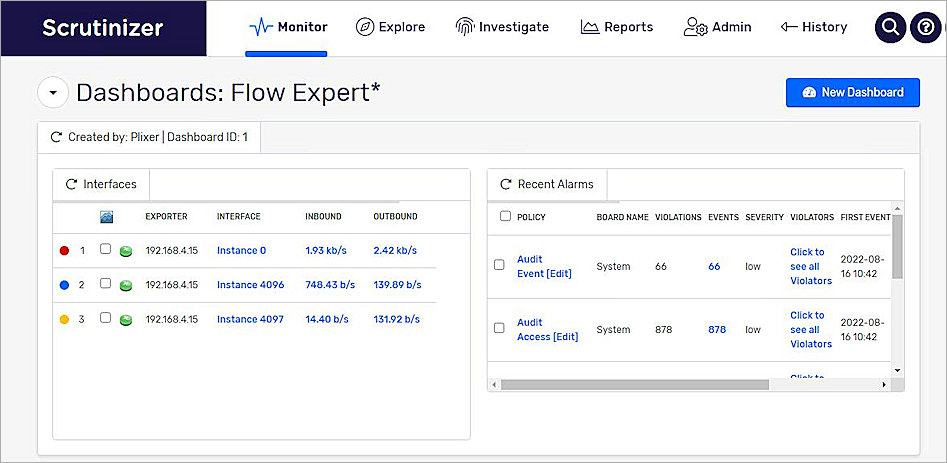
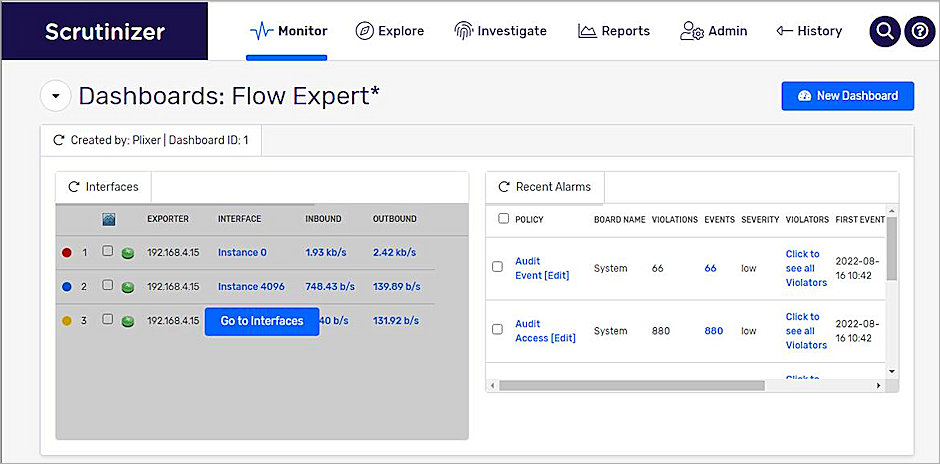
The default user name and password is admin/admin. - Select Monitor -> Dashboards.
Dashboards: Flow Expert* shows Firebox data.
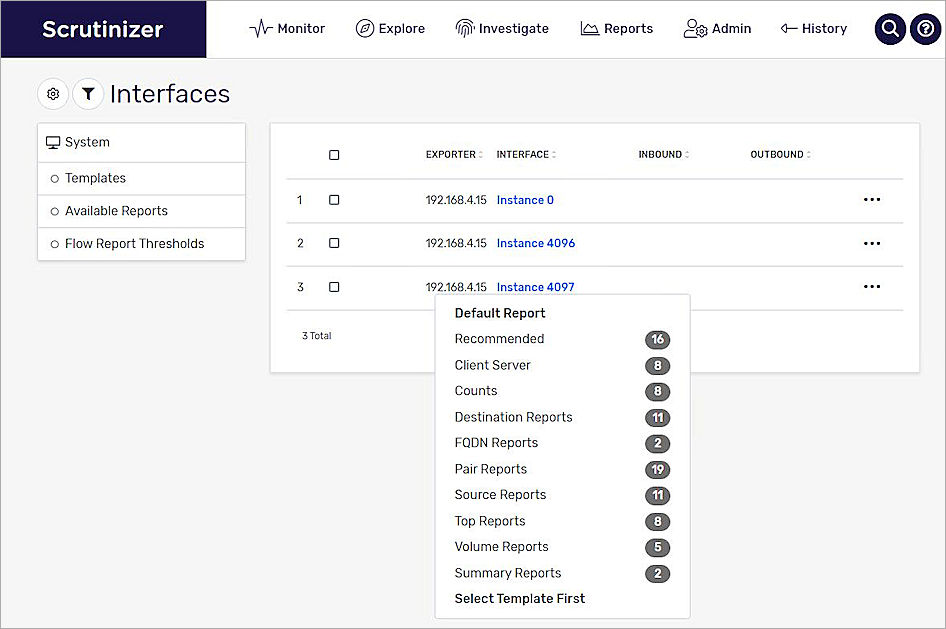
- To see detailed information, use the mouse cursor to point to the Interfaces tile. Click Go to Interfaces.
- To see the details, in the Interface column, click the hyperlink.