Microsoft Defender for Cloud Apps is a Cloud Access Security Broker (CASB) that supports various deployment modes, such as log collection, API connectors, and reverse proxy. It provides rich visibility, control over data travel, and sophisticated analytics to identify and combat cyberthreats across all your Microsoft and third-party cloud services.
This document describes the steps to integrate Microsoft Defender for Cloud Apps with your WatchGuard Firebox.
Contents
Platform and Software
The hardware and software used to complete the steps outlined in this document include:
- Microsoft Defender for Cloud Apps
- WatchGuard Firebox
- Fireware v12.10
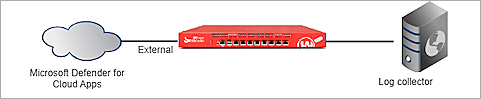
Test Topology
Set Up Microsoft Defender for Cloud Apps
Microsoft Defender for Cloud Apps is now part of Microsoft 365 Defender, which correlates singles from across the Microsoft Defender suite and provides incident-level detection, investigation, and powerful response capability. It is a comprehensive cross-SaaS solution bringing deep visibility, strong data controls, and enhanced threat protection to your cloud apps.
- Log in to the Microsoft 365 Defender portal.
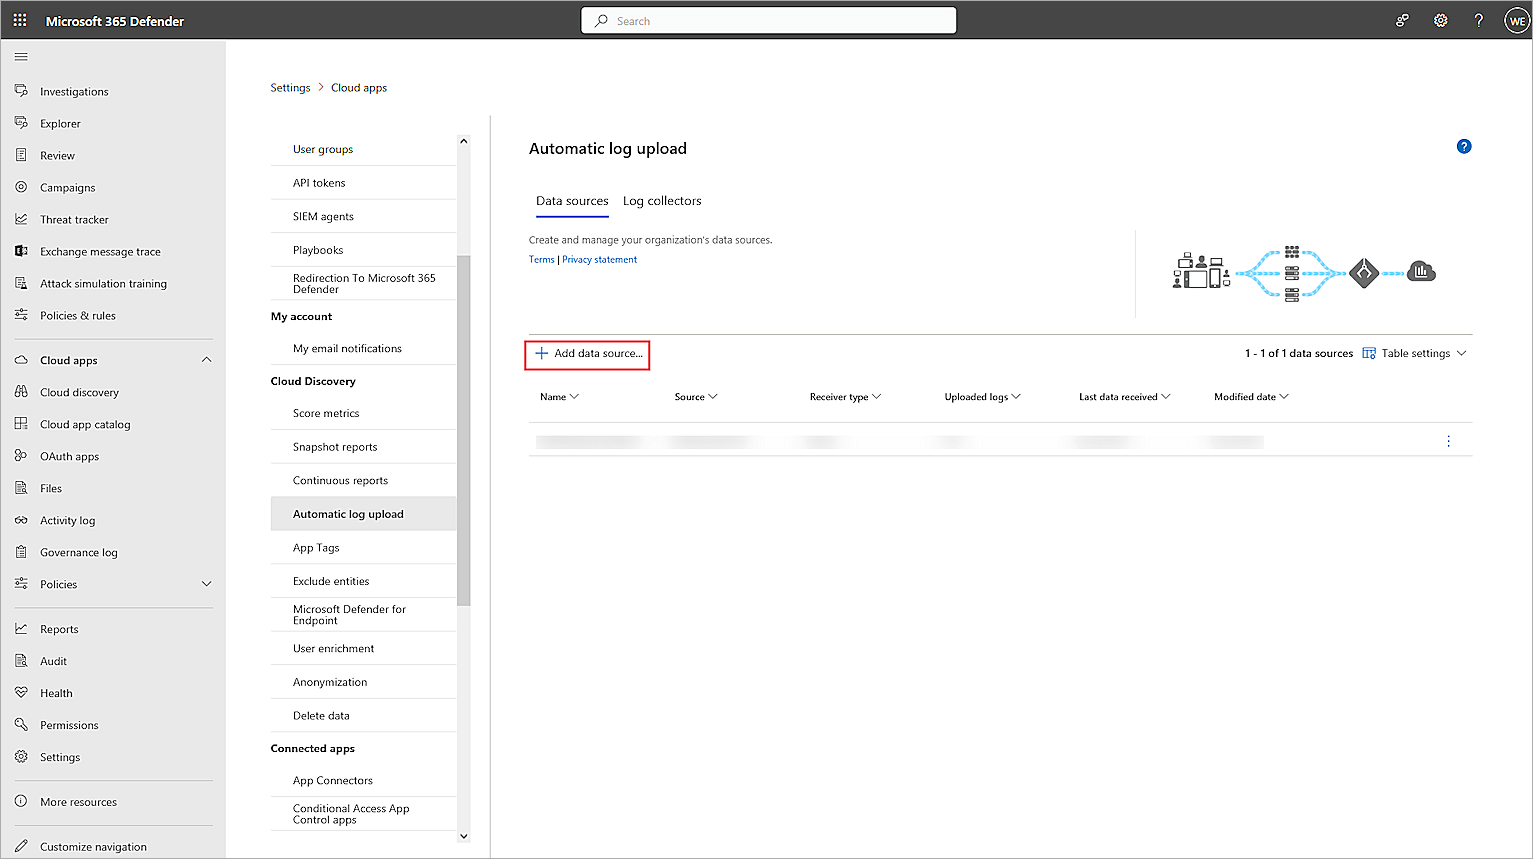
- Select Settings > Cloud Apps.
- Under Cloud Discovery, select Automatic Log Upload > Data Sources.
- Click Add Data Source.
- In the Name text box, type the data source name.
- From the Source drop-down list, select WatchGuard XTM.
- Click View Sample of Expected Log File > Download Sample Log. Make sure that the downloaded sample log matches your log files.
- From the Receiver Type drop-down list, select Syslog - UDP.
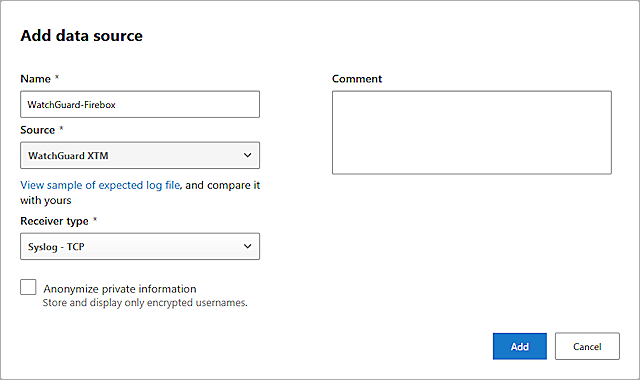
- Click Add.
- Select the Log Collectors tab.
- Click Add Log Collector.
- In the Name text box, type the log collector name.
- In the Host IP Address or FQDN text box, type the log collector server IP address.
- In the Data Source(s) text box, select the data source you added.
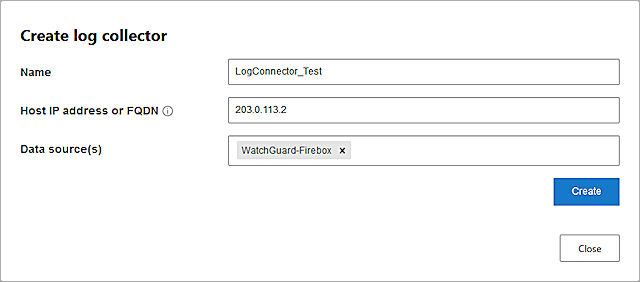
- Click Create.
- Follow the guide to deploy the log collector server.
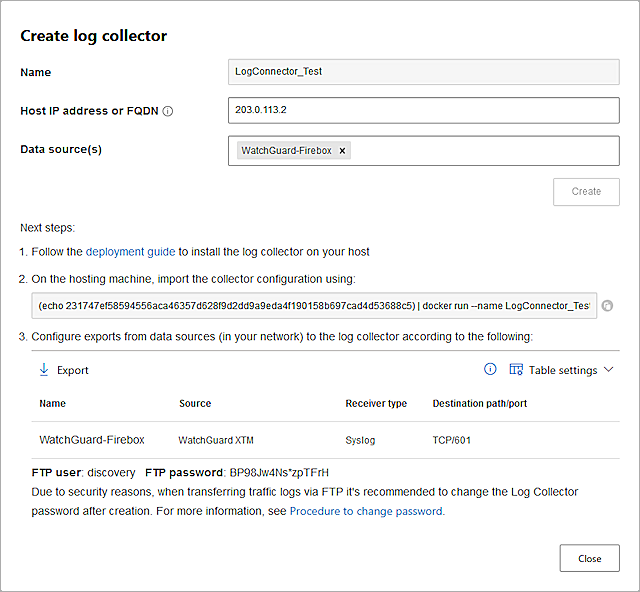
- Click Close.
Set Up Firebox
Complete the steps in this section to set up your Firebox.
Add a Syslog Server
- Log in to Fireware Web UI (https://<your firebox IP address>:8080).
- Select System > Logging.
The Logging page opens. - Select the Syslog Server tab.
- Select the Send Log Messages to these Syslog Servers check box.
- Click Add.
The Syslog Server dialog box opens. - In the IP Address text box, type the IP address of your log collector server.
- In the Port text box, type 514.
- From the Log Format drop-down list, select IBM LEEF.
- Do not change the default values for the other Syslog Server settings.
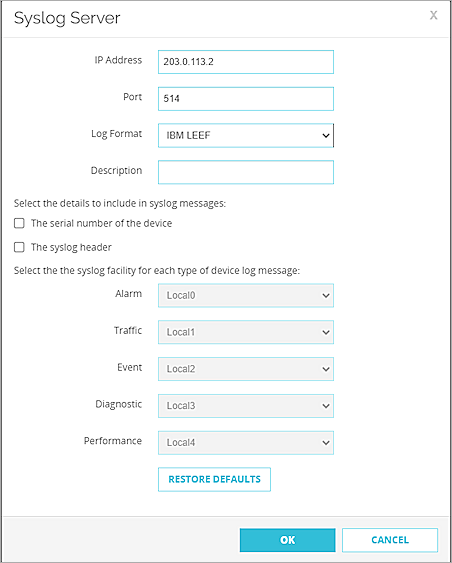
- Click OK.
- Click Save.
Add a Proxy Policy
When you add a proxy policy to your Firebox configuration file, you specify types of network traffic that the Firebox must examine. If the traffic matches (or does not match) the criteria you set in the proxy definition, the Firebox either allows or denies the traffic. In this example, we add a HTTPS-Proxy policy with the HTTPS-Client.Standard action.
- In the default firewall state, with no proxy policies and no traffic through the Firebox, you might see the message "Failed, Log format does not match the expected format for WATCHGUARD_XTM_SYSLOG" in the governance log. You can ignore this message.
- Verify your log format to make sure that it is formatted correctly, based on the sample log downloaded from Microsoft Defender for Cloud Apps.

-
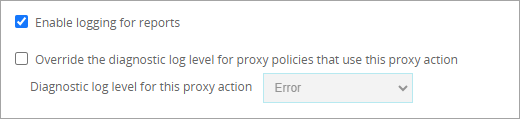
When you want the Firebox to generate a log for an event, make sure you select the Enable Logging for Reports check box in the proxy action General Settings.
Test the Integration
- Log in to Microsoft 365 Defender portal.
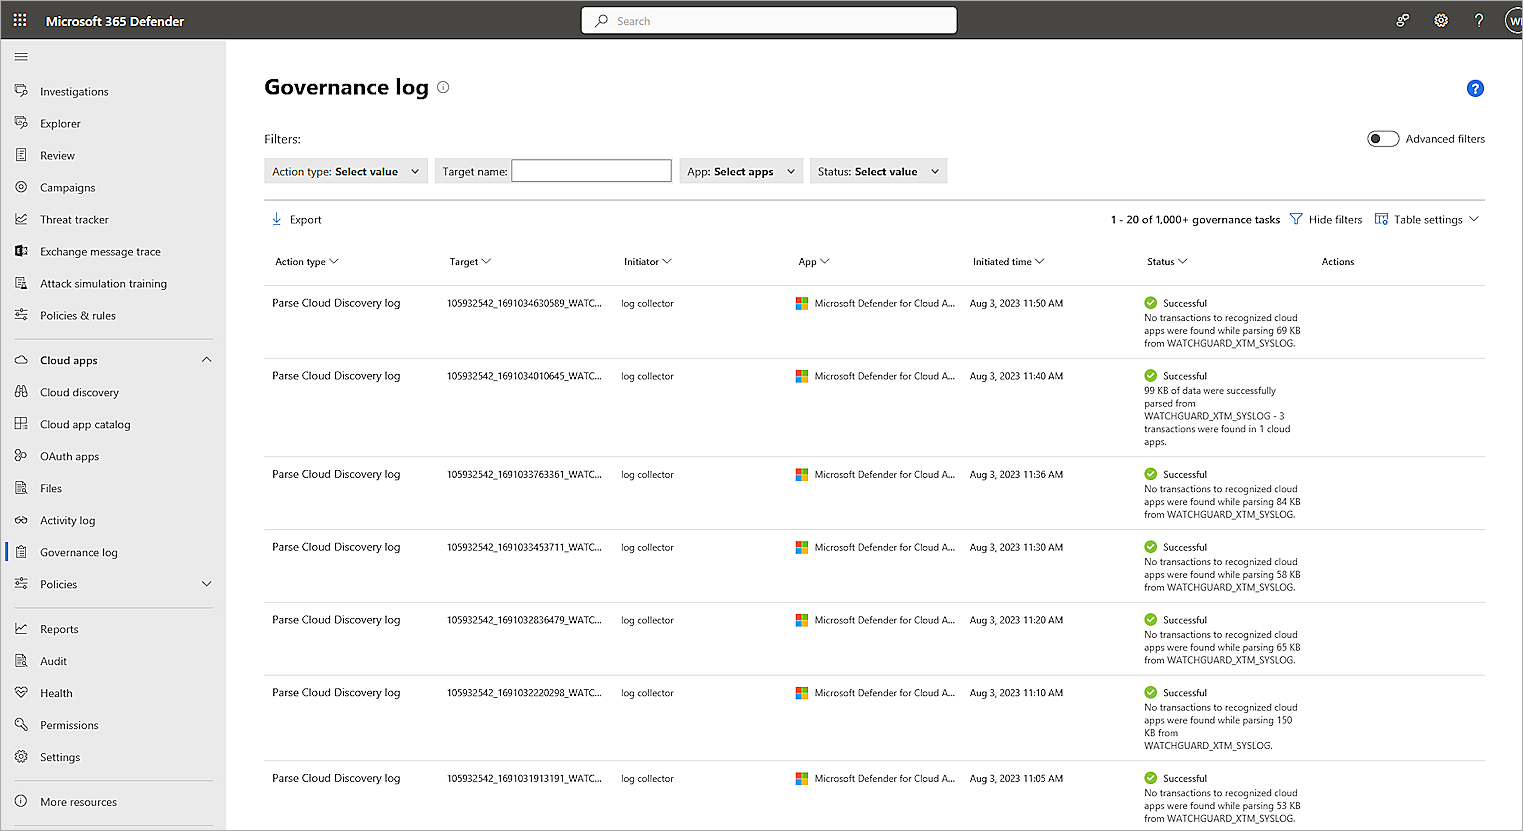
- Select Cloud Apps > Governance Log.
- Confirm that the status for the Parse Cloud Discovery Log is Successful.
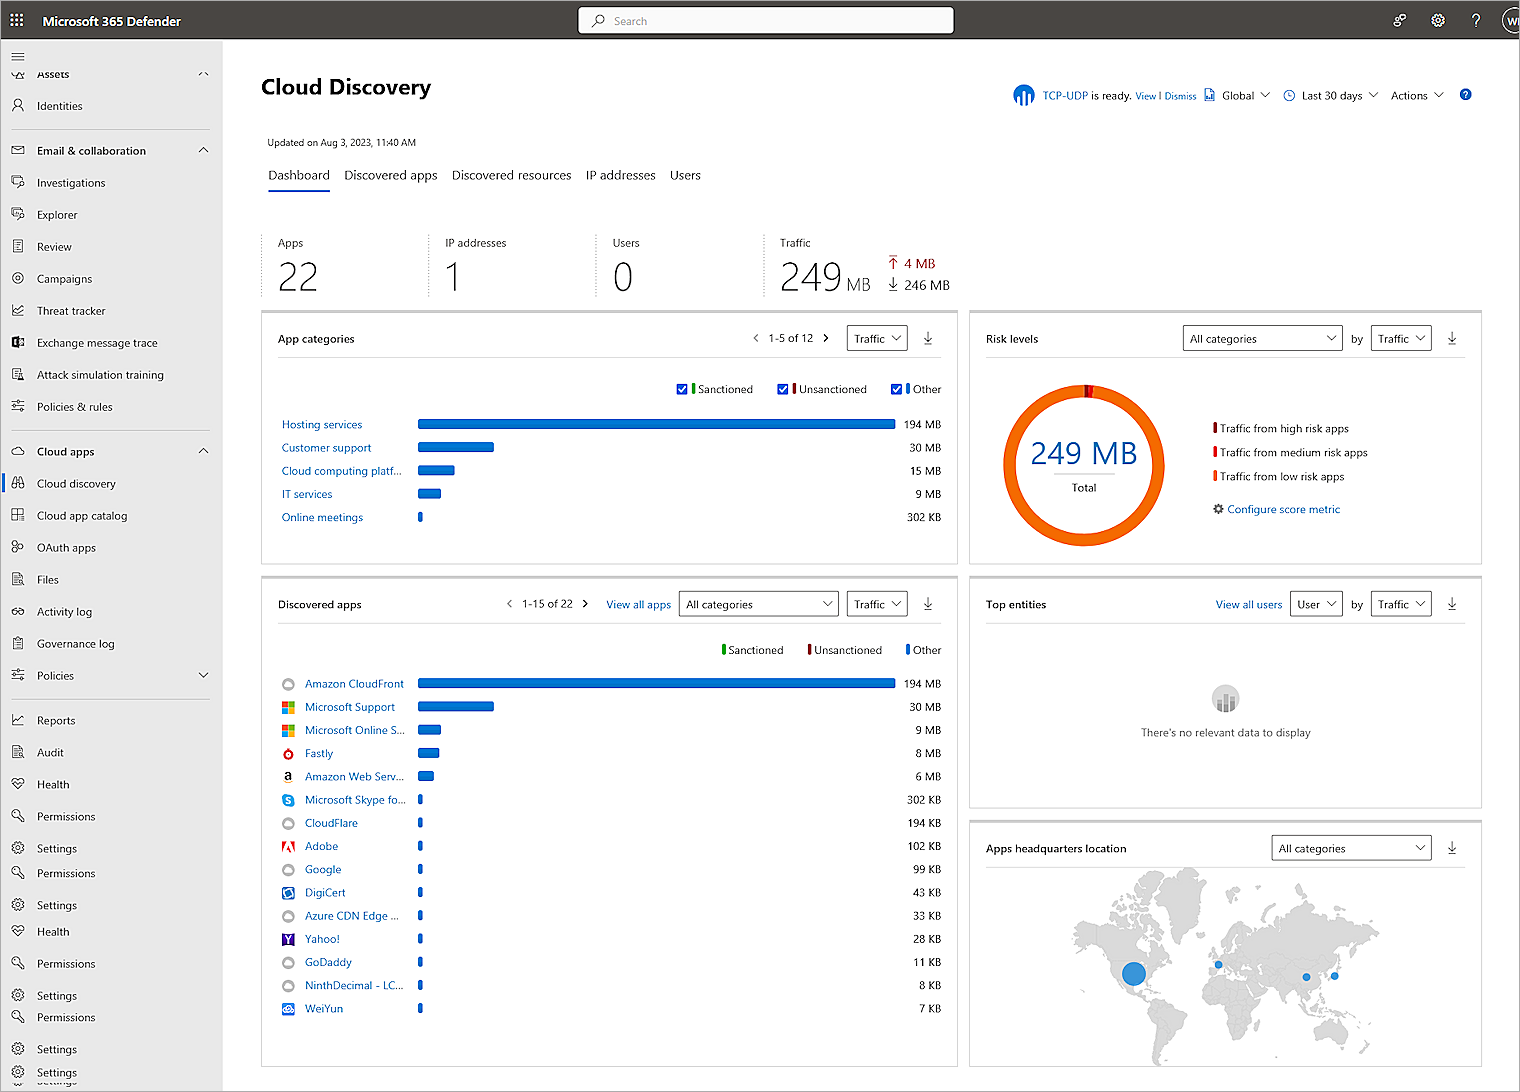
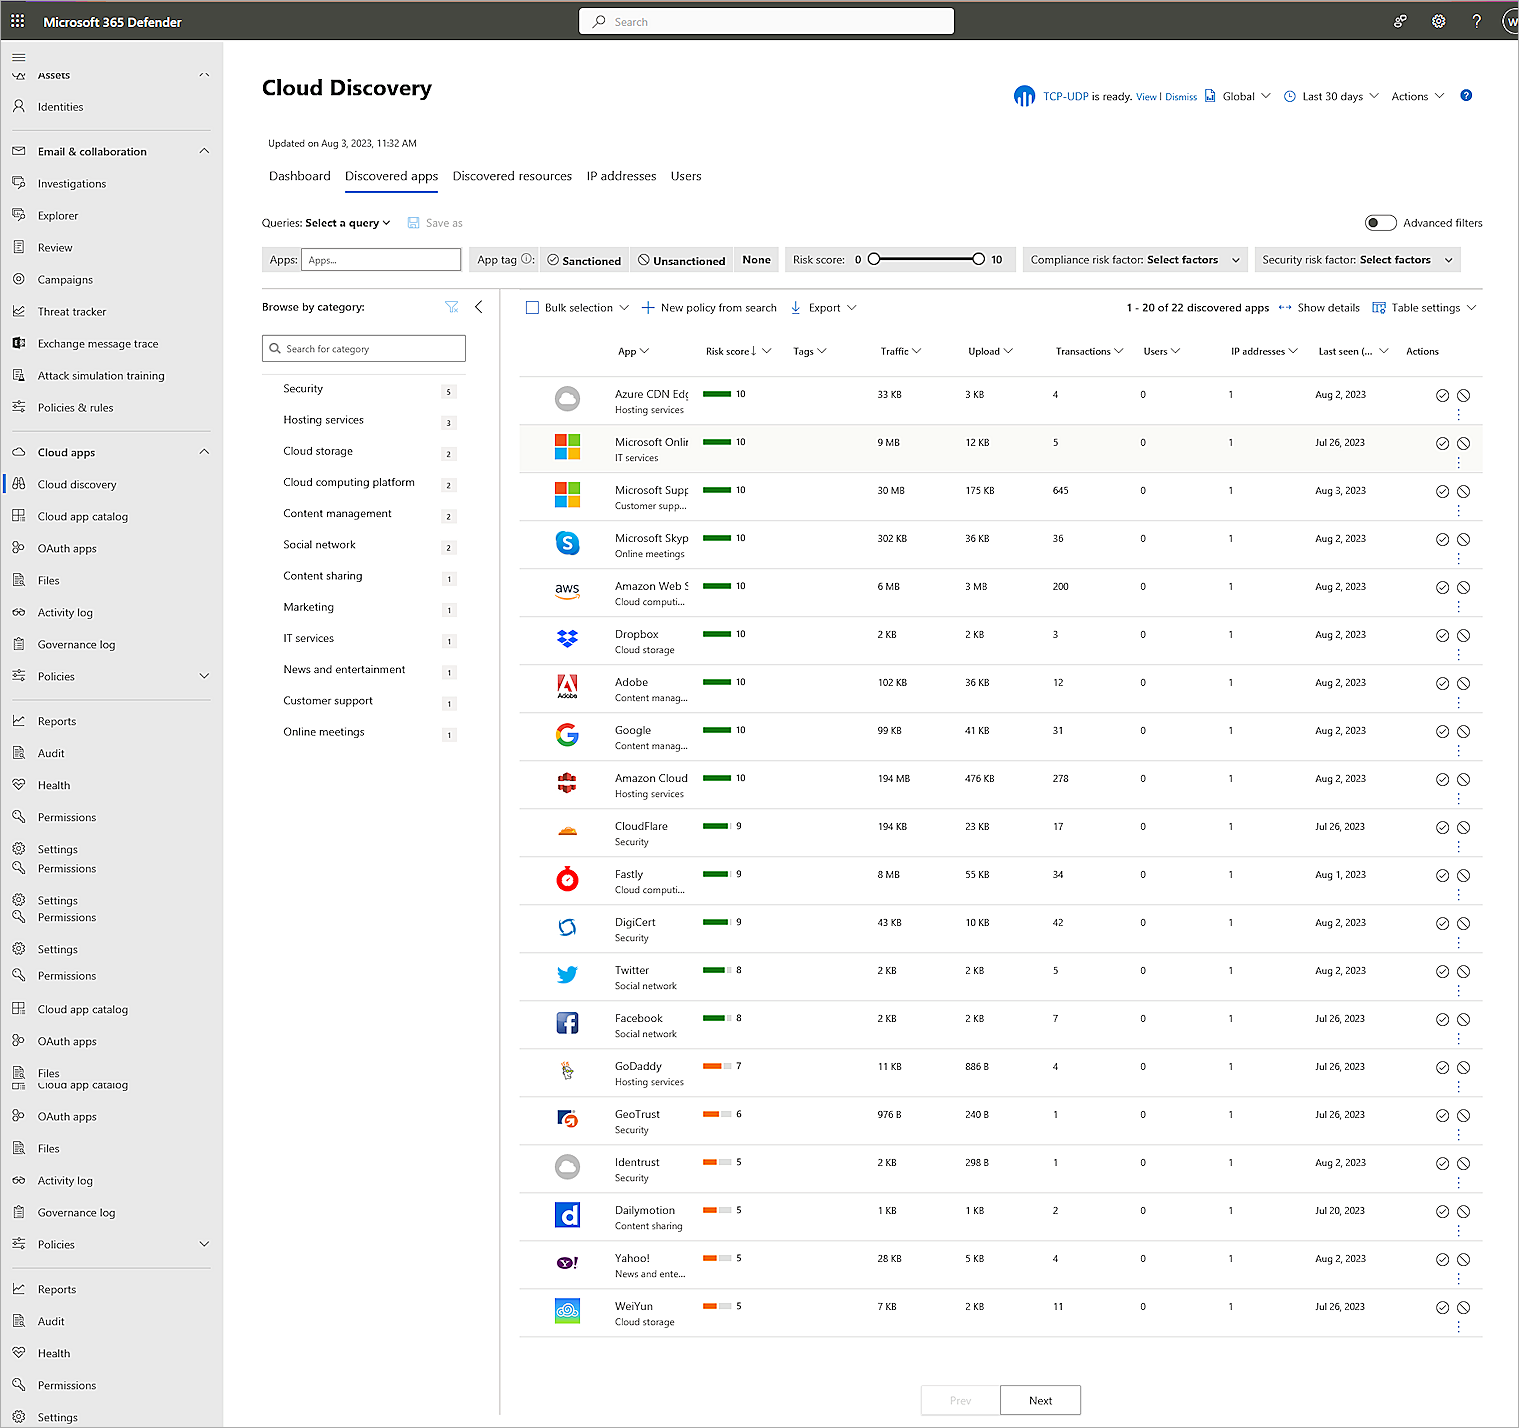
- Select Cloud Apps > Cloud Discovery.
- Confirm that the integration was successful.