This document describes the integration of Microsoft Sentinel with your WatchGuard Firebox.
Microsoft Sentinel is a scalable, cloud-native security information event management (SIEM) and security orchestration automated response (SOAR) solution. Microsoft Sentinel delivers intelligent security analytics and threat intelligence across the enterprise and provides a single solution for alert detection, threat visibility, proactive hunting, and threat response.
The Microsoft Sentinel integration does not currently support Fireboxes deployed in Azure Government Community Cloud.
Contents
Integration Summary
The hardware and software used in this guide include:
- Microsoft Sentinel Cloud
- Microsoft Monitoring Agent
- Rsyslog Server with v8.24.0-57.el7_9.3
- Firebox or FireboxV with Fireware v12.10 or higher
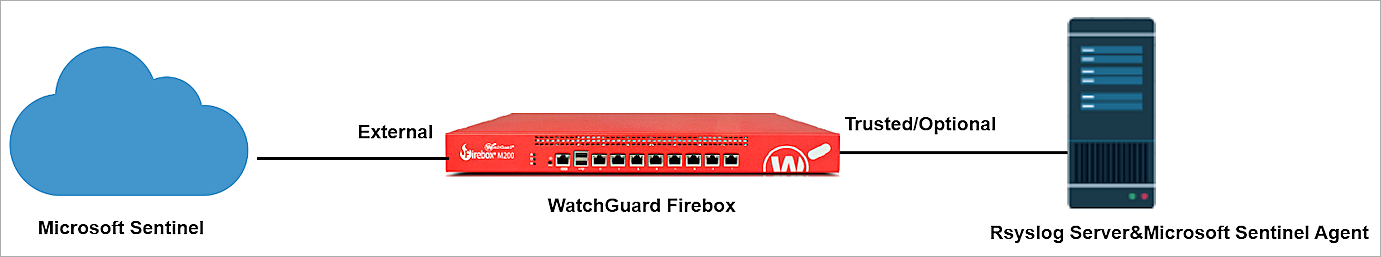
Topology
Before You Begin
Before you begin these procedures, make sure that:
- You have configured the workspace and resource group in Microsoft Sentinel.
- You have installed and configured your rsyslog server.
- Your rsyslog server can receive Firebox logs.
To configure Microsoft Sentinel with your Firebox, complete these steps:
Register the Syslog Server with Azure
To register the syslog server with Azure:
- Log in to Microsoft Azure with an administrator account.
- In the Search Resources, Services, and Docs search box, search for and select Azure Arc.
The Azure Arc configuration page opens. - From the left navigation menu, select All Azure resources > Infrastructure > Machines.
The Machines page opens. - From the Onboard/Create drop-down list, select Onboard existing machines.
The Onboard Existing Machines with Azure Arc page opens. - From the Basics tab:
- In the Project details section:
- From the Subscription drop-down list, select your subscription.
- From the Resource group drop-down list, select the group to which you want to register your syslog server.
- In the Server details section:
- From the Region drop-down list, select the group where you want to register your syslog server.
- From the Operating system drop-down list, select Linux.
- In the Authentication method section:
- Select Authenticate machines manually.
- Keep other values as their defaults, click Next.
- In the Project details section:
- From the Tags tab, click Next.
- From the Download and run script tab,:
- Click Download to download the registration script.
- Click Close.
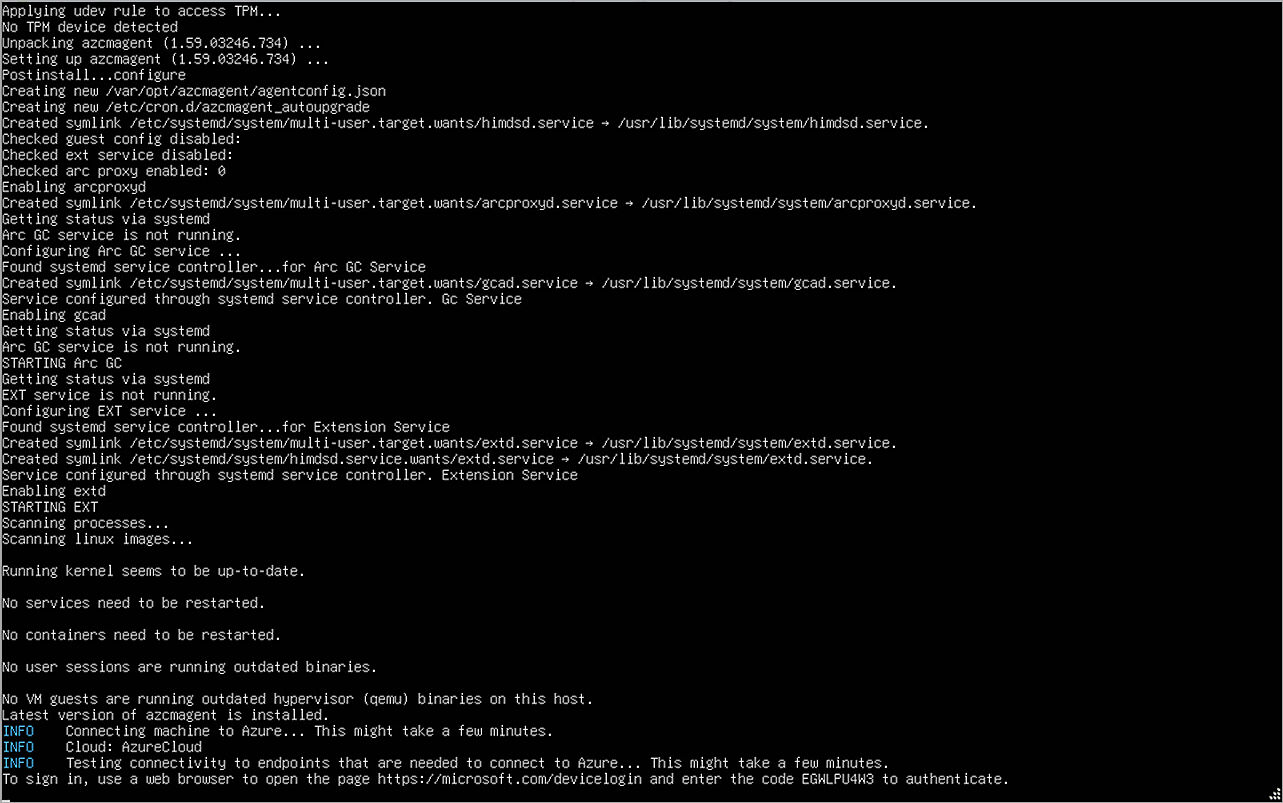
- Run the registration script on the host you want to register with the Azure platform.
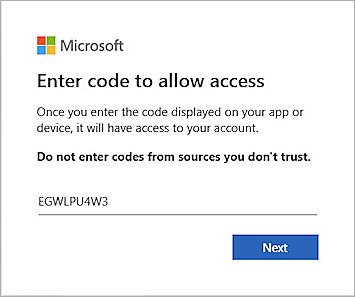
After a short amount of time, a URL and verification code appear. - Go to https://microsoft.com/devicelogin (external link) and type the verification code.
- After registration is complete, view the host on Azure.
- Click the name of the device.
The Machine Overview page opens. - From the left navigation, select Settings > Extensions.
- Click Add.
The Install Extension page opens. - Select Azure Monitor Agent for Linux.
- Click Next.
- Click Review + create.
- Click Create.
- Log in to the Microsoft Azure portal.
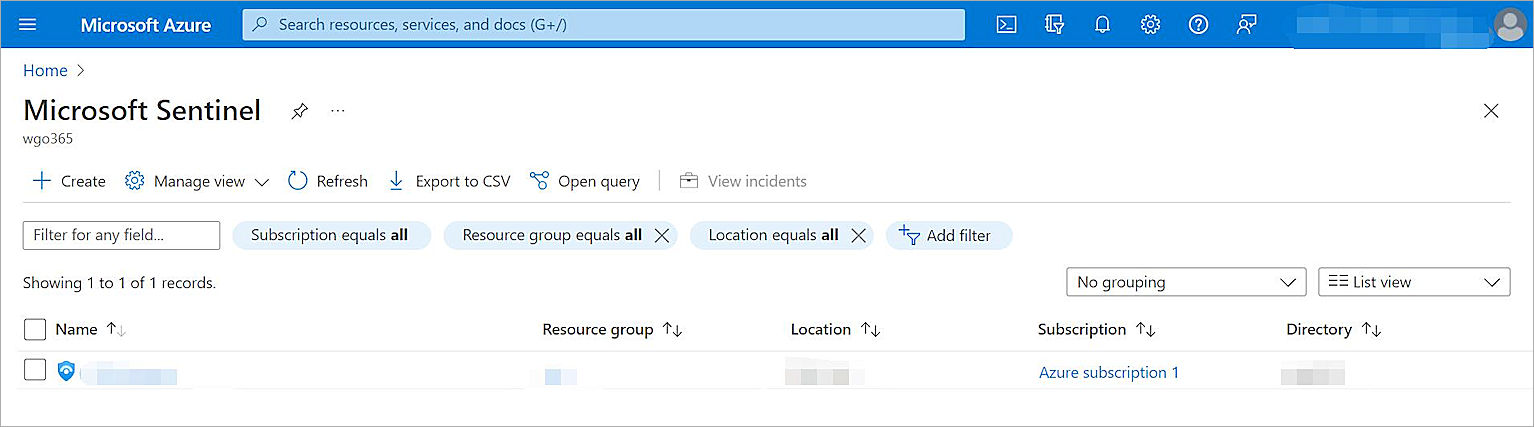
- In the Search Resources, Services, and Docs search box, search for and select Microsoft Sentinel.
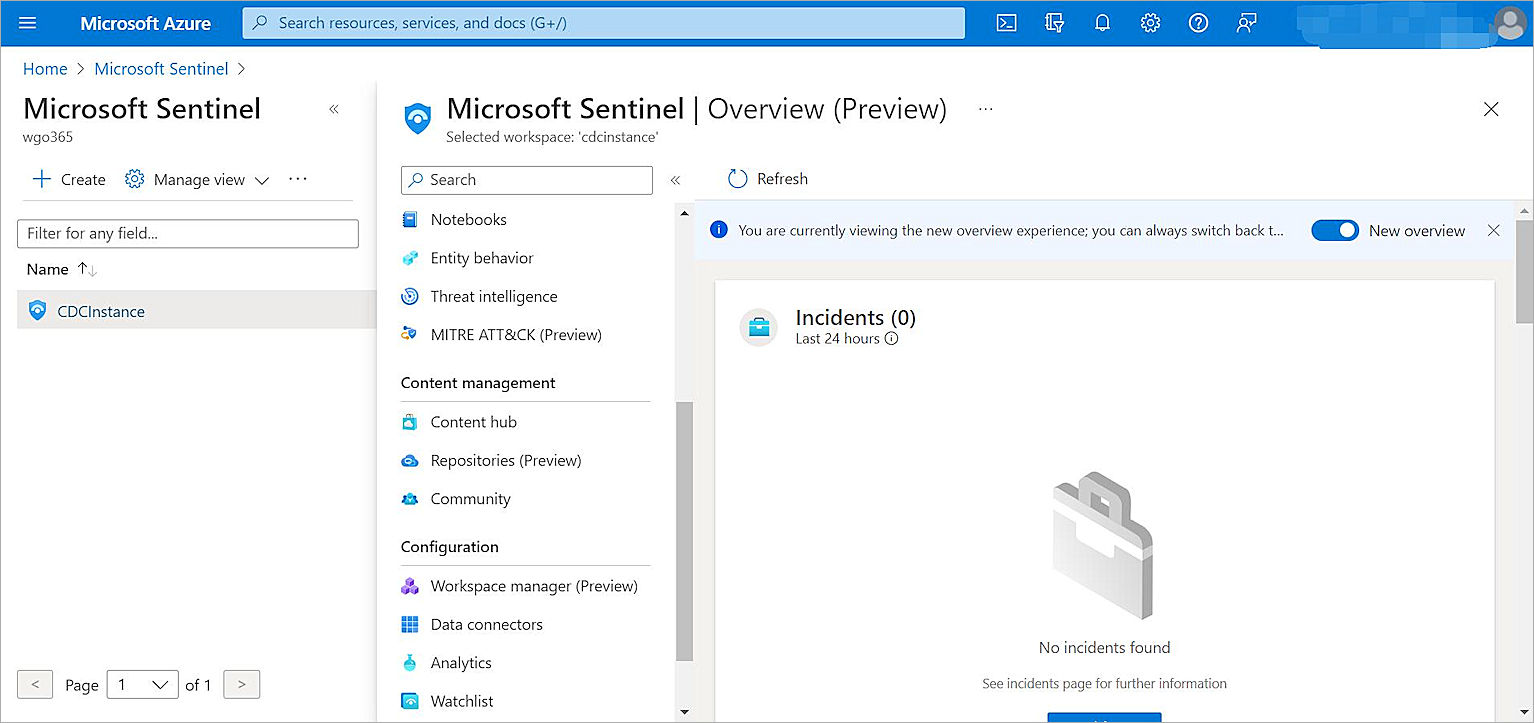
The Microsoft Sentinel page opens with the list of workspaces that have Microsoft Sentinel installed. - From the list, select your workspace.
The Microsoft Sentinel Overview page for the workspace you select opens. - On the Overview page, from the navigation menu, in the Content Management section, select Content Hub.
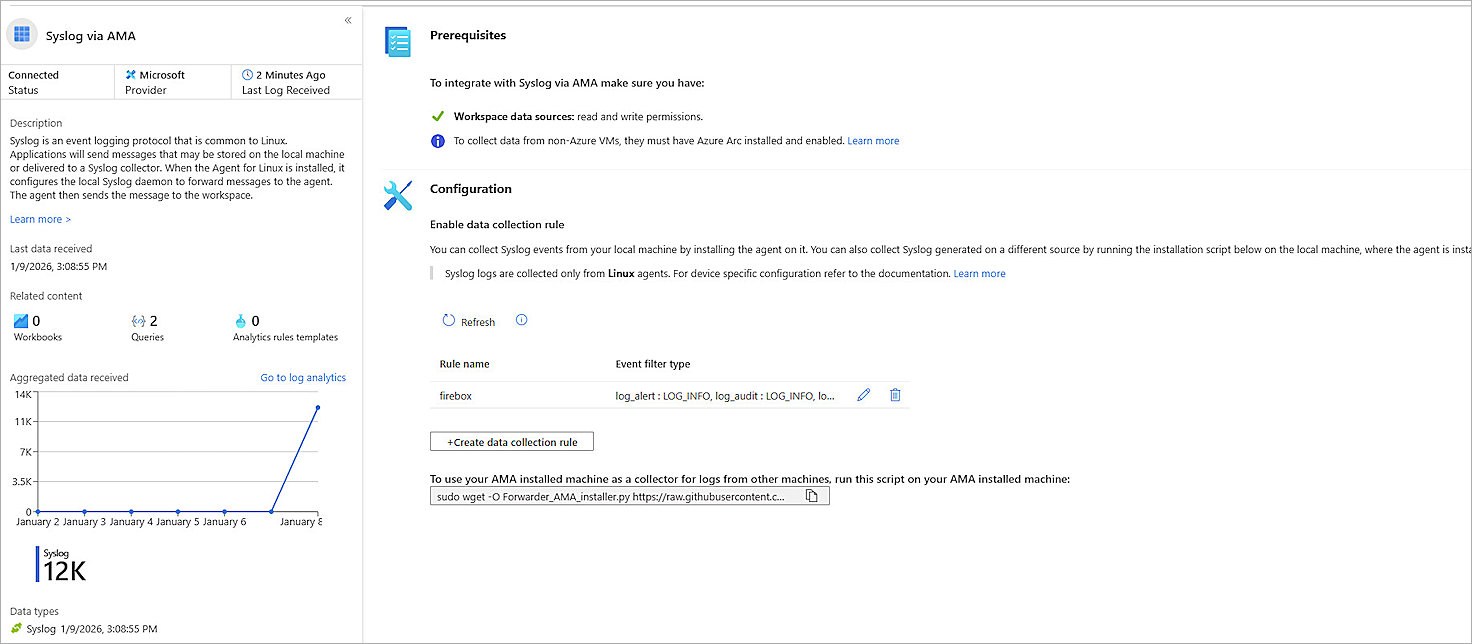
The Content Hub page opens. - On the Content Hub page, search for and select the Syslog via AMA connector.
- Click Open connector page at the bottom right of the page.
The Syslog via AMA configuration page opens. - In the Configuration section, click +Create data collection rule.
The Create Data Collection Rule configuration page opens. - From the Basic tab:
- In the Rule name text box, type a descriptive name for the rule.
- From the Subscription and Resource group drop-down list, select the subscription and resource group your syslog server is registered to.
- Click Next: Resources.
- From the Resources tab:
- Select the machine that you have registered with Azure.
- Click Next: Collect.
- From the Collect tab:
- Select Collect messages without PRI header (facility and severity).
- Select Minimum as the log level for each Facility.
- Click Next: Review + create.
- From the Review + create tab, click Create.
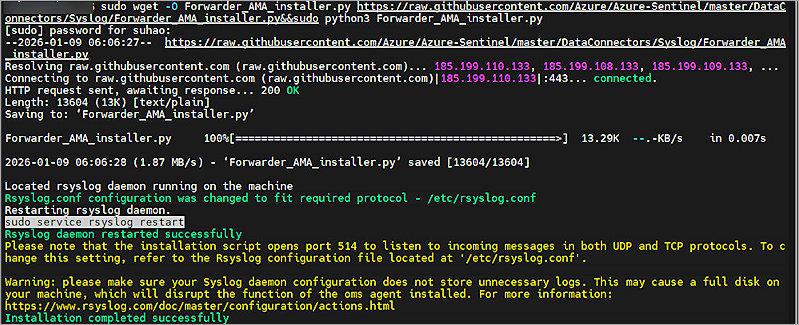
- Copy the command from the lower area of the page, and run the command from a command window on your computer.
Disable Uncomplicated Firewall (UFW) on your host; else registration might fail.

It might take some time for the Azure Monitor Agent to deploy.
Configure Microsoft Sentinel
To configure Microsoft Sentinel:
- Log in to the Microsoft Azure portal.
- In the Search Resources, Services, and Docs search box, search for and select Microsoft Sentinel.
The Microsoft Sentinel page opens with the list of workspaces that have Microsoft Sentinel installed. - From the list of workspaces, select your workspace.
The Microsoft Sentinel Overview page for your selected workspace opens. - On the Overview page, from the navigation menu, in the Content Management section, select Content Hub.
The Content Hub page opens. - On the Content Hub page, search for and select the WatchGuard Firebox connector.
- Click Install.
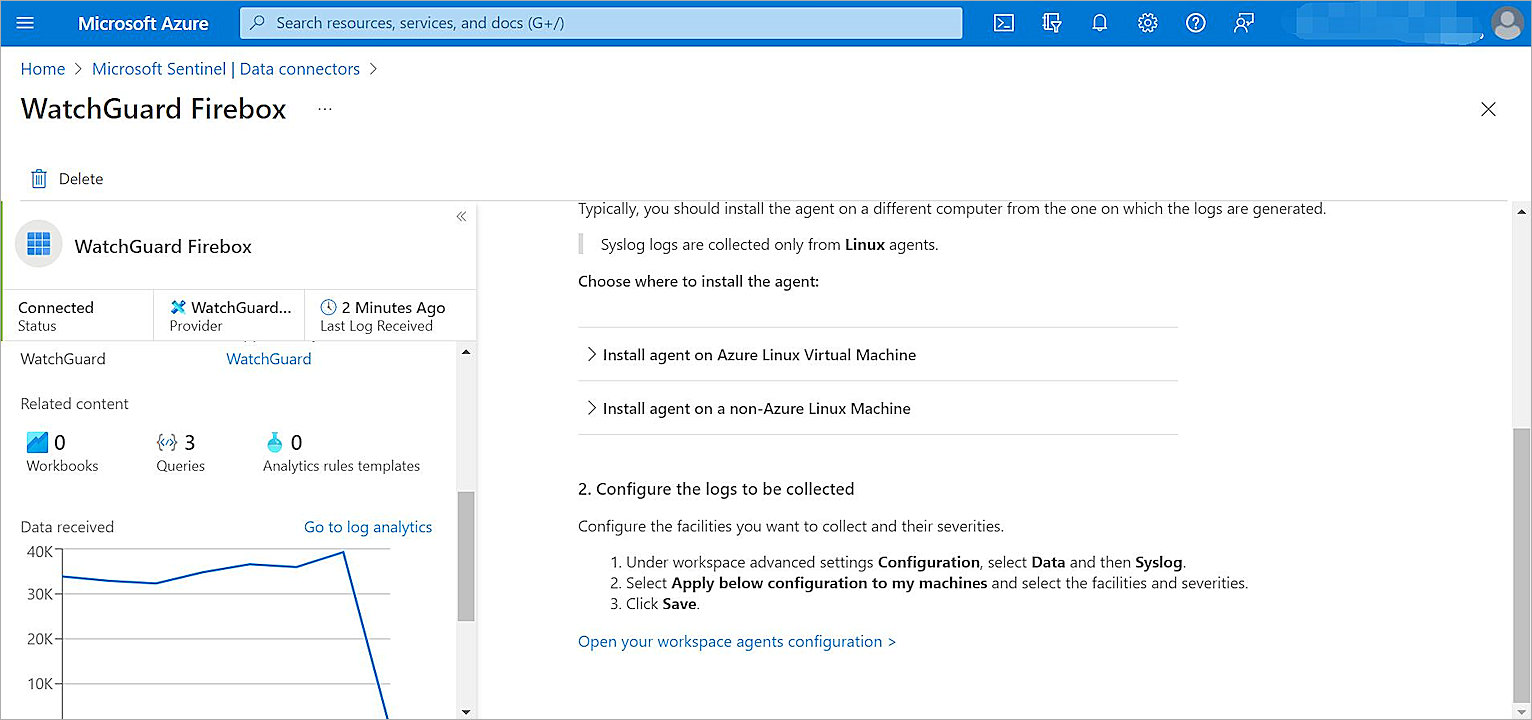
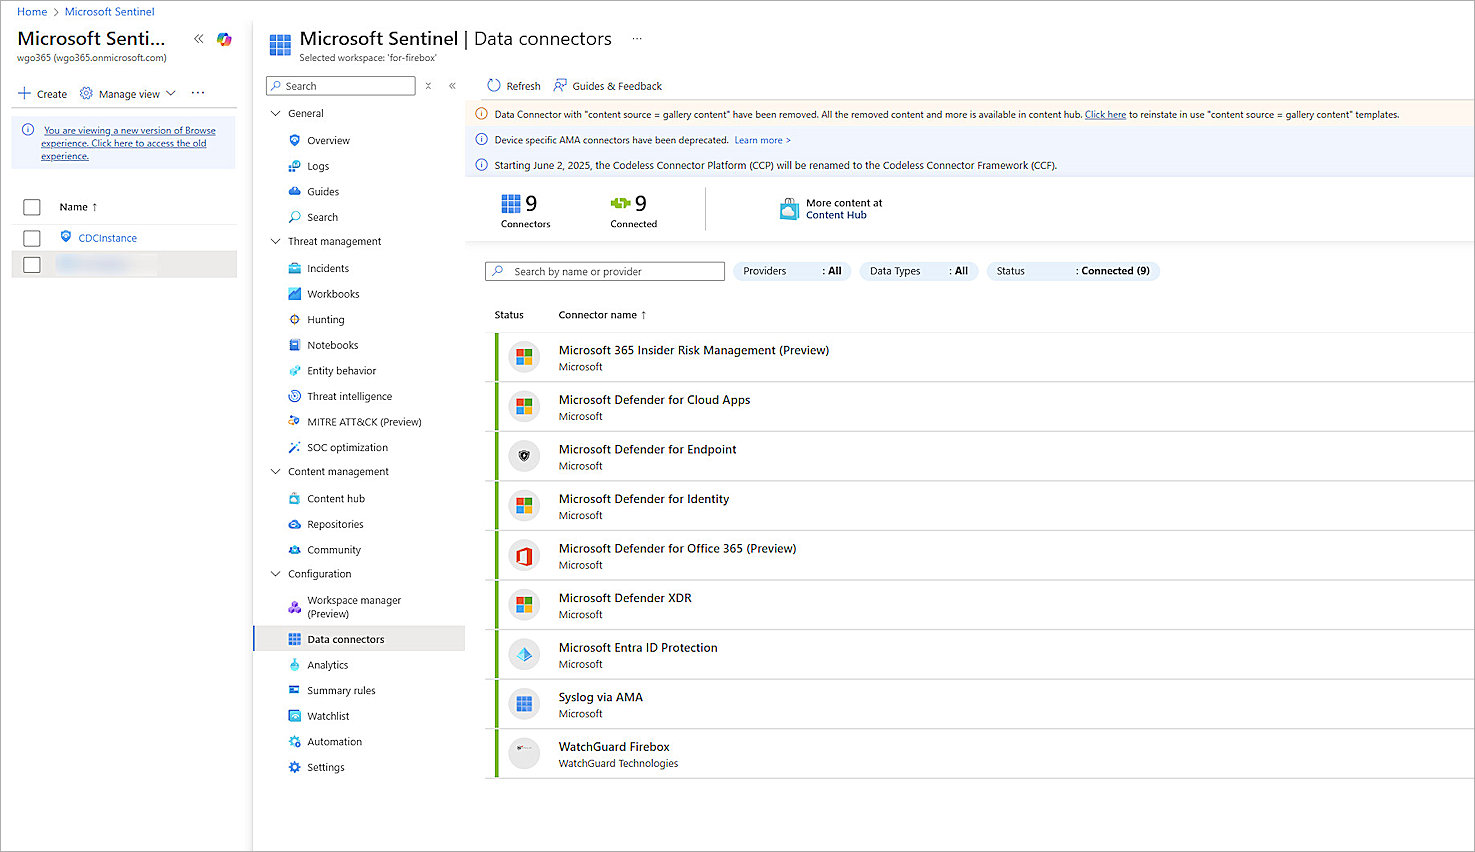
The WatchGuard Firebox connector installs. - From the navigation menu, in the Configuration section, select Data Connectors.
- Select the WatchGuard Firebox connector.
- Click Go to Log Analytics.
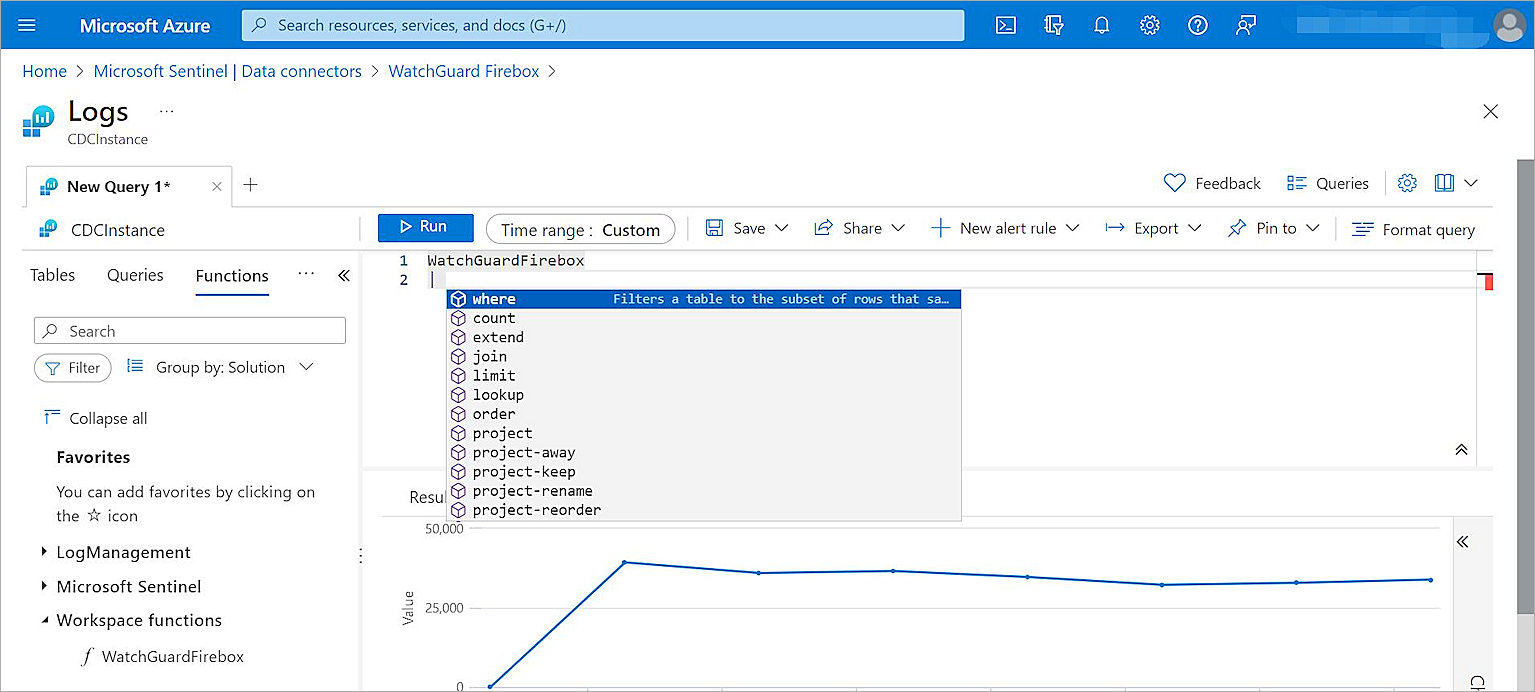
The Logs page opens. - From the navigation menu, select Functions > Workspace Functions.
- Verify that the WatchGuardFirebox function exists and that Microsoft Sentinel can analyze the function.
Configure the Firebox
To configure your Firebox:
- Log in to Fireware Web UI at https://<your firebox IP address>:8080.
- Select System > Logging.
The Logging page opens. - Select the Syslog Server tab.
- Select the Send Log Messages to These Syslog Servers check box.
- Click Add.
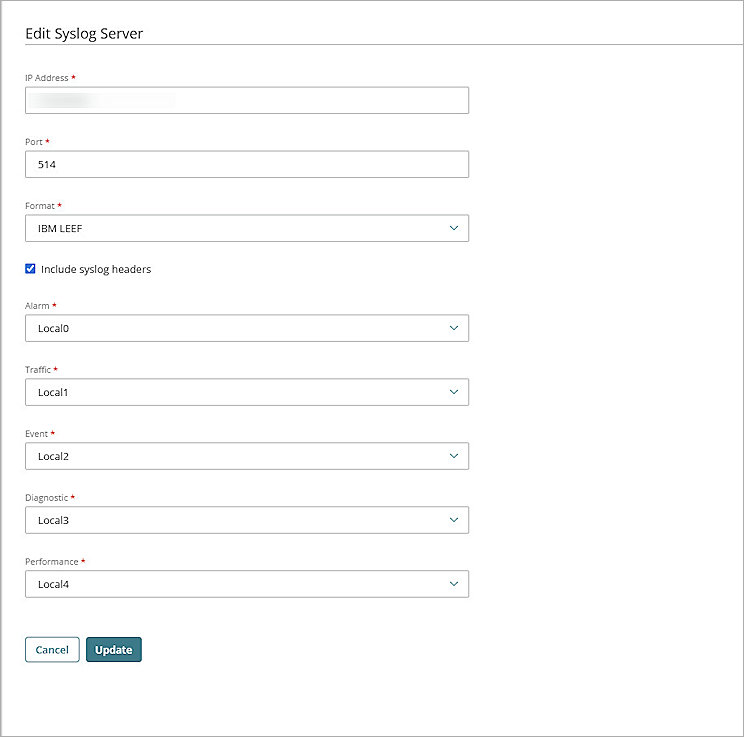
The Syslog Server dialog box opens. - In the IP Address text box, type the IP address of your Microsoft Monitoring Agent.
- In the Port text box, type 514.
- From the Log Format drop-down list, select IBM LEEF.
- For each type of device log message, from the drop-down list, select the syslog facility.
- Click OK.
- Click Save.
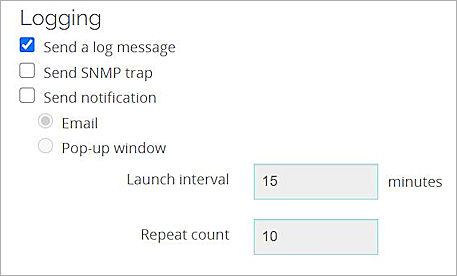
You can configure logging in many areas in the Firebox configuration, such as policies and proxies. Make sure you select Send a Log Message when you want the Firebox to generate a log message for an event.
Test the Integration
To test the integration of Microsoft Sentinel with your Firebox, after the Firebox starts to send logs to Microsoft Monitoring Agent:
- Log in to the Microsoft Azure portal.
- From the search box, search for and select Microsoft Sentinel.
- Selected the workspace you created.
- From the navigation menu, in the Configuration section, select Data Connectors.
- Select the WatchGuard Firebox connector.
- Select Go to Log Analytics.
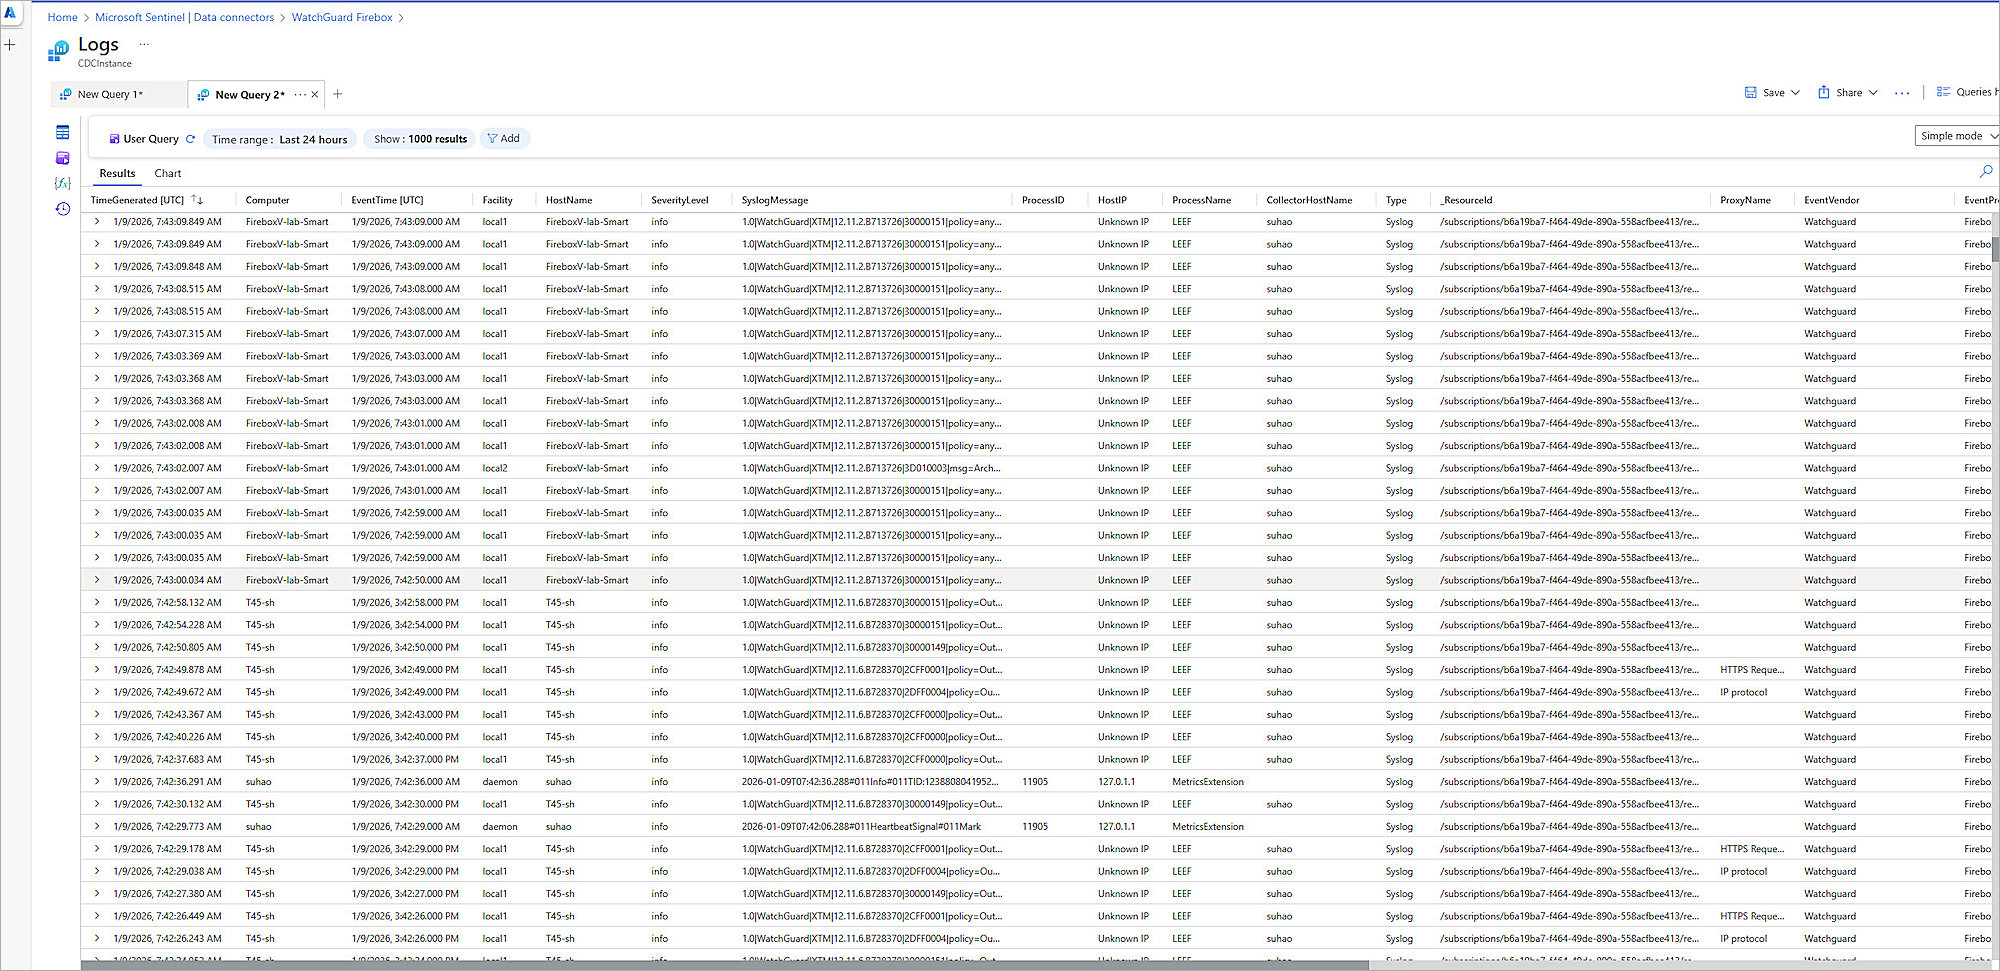
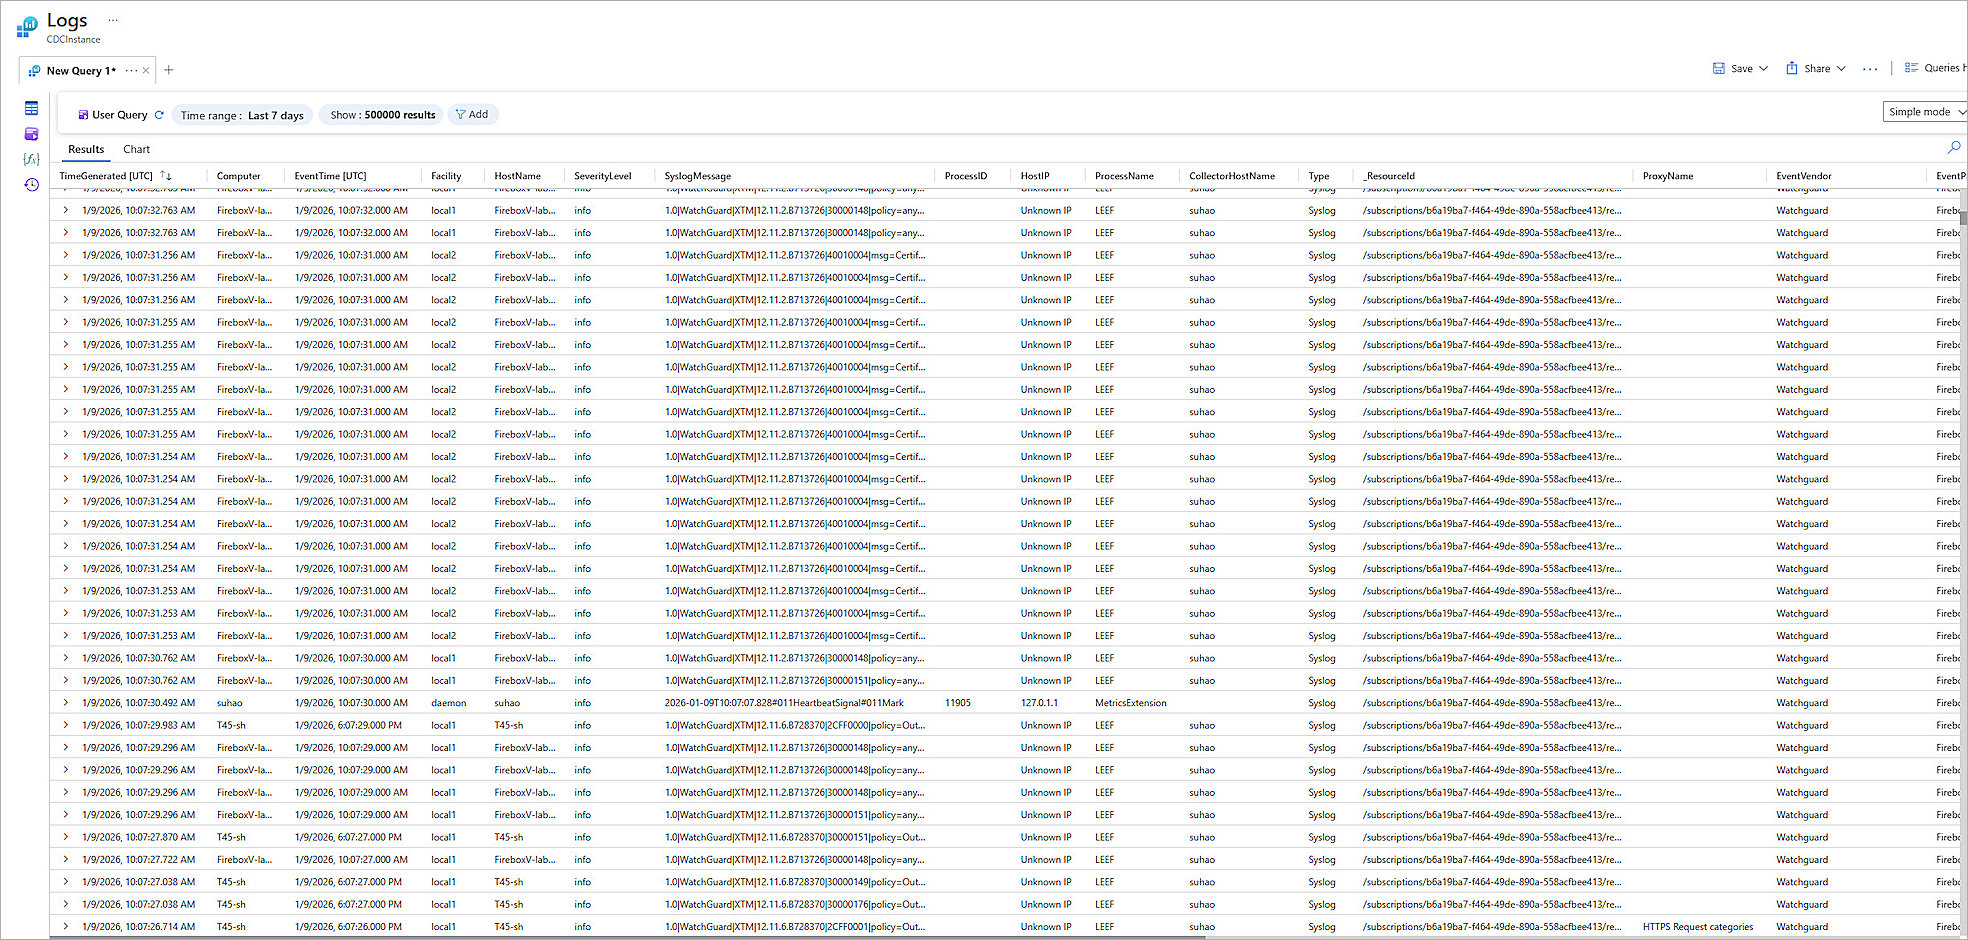
The Logs page opens. - Run queries to get the information you want.
You can use the queries to:
- Filter Logs
- View the Parse Definitions
Filter Logs
Information from sources other than the Firebox can sometimes appear in Syslog data. To run a query that returns events from only the Firebox, you can filter the query by host name or computer.
Example 1
Query that excludes events from the host name localhost:
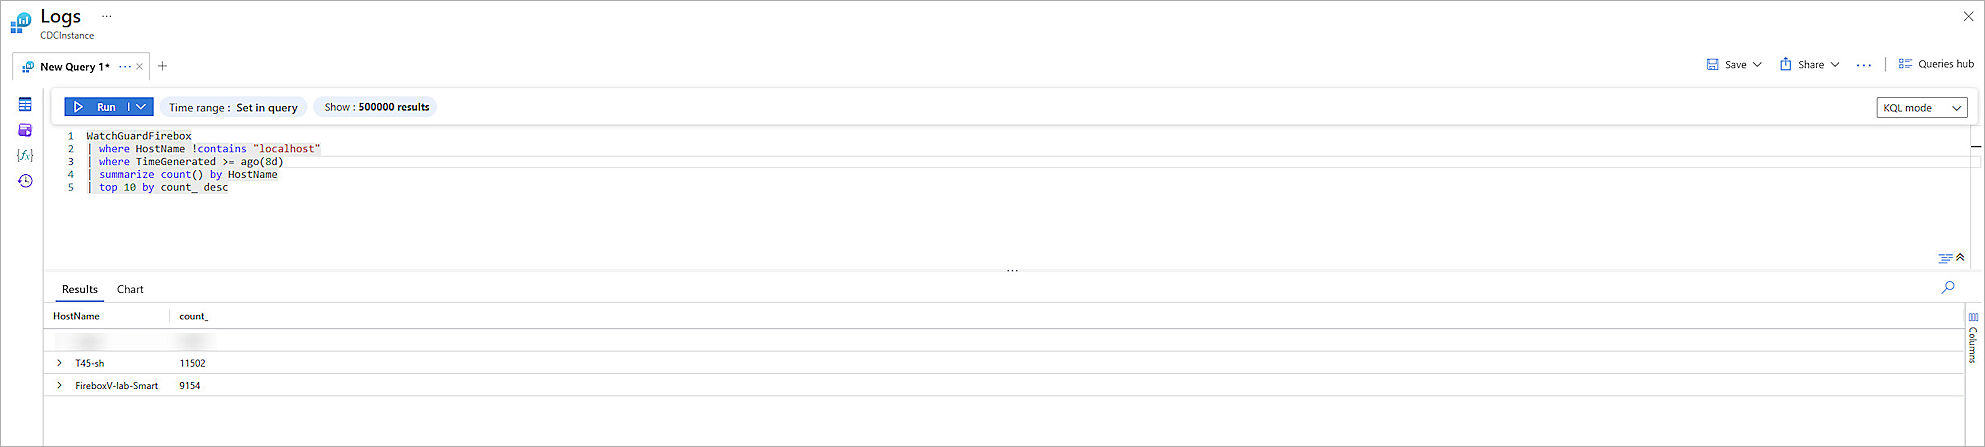
Example 2
Query that includes events from only the hostname FireboxV-lab-Smart:

Parser Definition
Users can verify which parsers are supported by the WatchGuard Firebox connector.
To view the supported parsers:
- On the WatchGuard Firebox connector Logs page, from the navigation menu, select Functions > Workspace Functions > WatchGuardFirebox.