Applies To: Cloud-managed Fireboxes, Locally-managed Fireboxes
Applies To: DNSWatch in WatchGuard Cloud
References to DNSWatch in this topic relate to DNSWatch in WatchGuard Cloud. To learn about the legacy DNSWatch UI, go to About WatchGuard DNSWatch in Fireware Help.
After you migrate to DNSWatch in WatchGuard Cloud from the legacy DNSWatch UI, you can view DNSWatch reports in WatchGuard Cloud only. You can no longer view reports in the legacy DNSWatch UI.
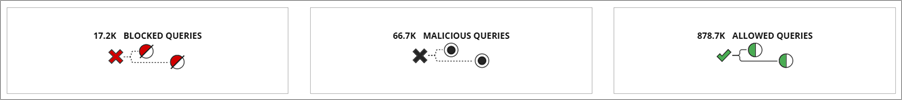
The DNSWatch Services and Detail reports show a summary of the blocked queries, malicious queries, and allowed queries detected by DNSWatch.
How to Use the DNSWatch Reports
The DNSWatch reports show the top instances of blocked, malicious, and allowed queries that users tried to connect to in the selected time period.
To use the DNSWatch reports:
- Click the Blocked Queries widget to filter the table and show all blocked queries.
- Click the Malicious Queries widget to filter the table and show all malicious queries.
- Click the Allowed Queries widget to filter the table and show all allowed queries.
View the DNSWatch Services Report
This report is available in WatchGuard Cloud and not available in Dimension.
To view the DNSWatch Services report:
- Log in to WatchGuard Cloud.
- Select Monitor > Devices.
- Select a folder or a specific device.
- In the Services section, select DNSWatch.
The DNSWatch Services report opens. - To select the report date range, click
 .
.
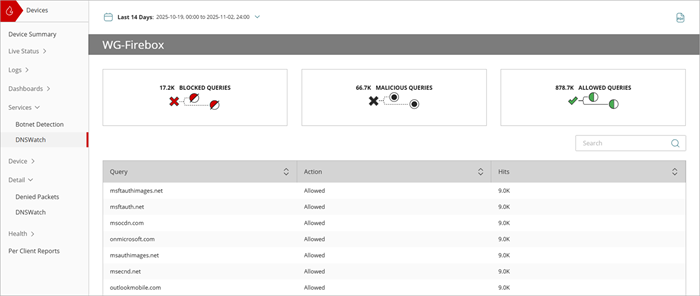
This report is available when log messages with data for this report exist in the specified time frame. To make sure that your Firebox sends log messages required to generate this report, follow the steps to Enable Logging for this Report.
View the DNSWatch Detail Report
The DNSWatch Detail report shows a detailed report of blocked and malicious activity detected by DNSWatch.
To view the DNSWatch Detail report:
- Log in to WatchGuard Cloud.
- Select Monitor > Devices.
- Select a folder or a specific device.
- In the Detail section, select DNSWatch.
The DNSWatch Detail report opens. - To select the report date range, click .
The DNSWatch Detail report includes a table that shows every instance of malicious or blocked activity detected by DNSWatch:
| Column | Description |
|---|---|
| Queries | The URL of the query. |
| Action | Action taken by DNSWatch, such as Allowed, Blocked, or Malicious. |
| DNSWatch Configuration | The associated DNSWatch configuration. Click the name to edit the configuration on the Configure > DNSWatch page. |
| Device | Name of the Firebox. |
| Date | Date and time that the event occurred. |
| Hits | Number of attempts. |
To download the DNSWatch report in .CSV format, click ![]() .
.
This report is available when log messages with data for this report exist in the specified time frame. To make sure that your Firebox sends log messages required to generate this report, follow the steps to Enable Logging for this Report.
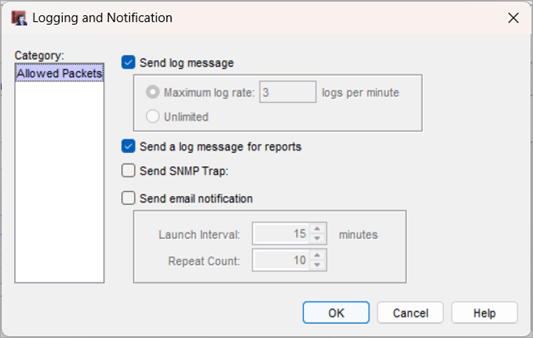
Enable Logging for this Report
Logging for cloud-managed Fireboxes is automatically enabled. For locally-managed Fireboxes, you must manually enable logging in Fireware Web UI or Policy Manager. For more information, go to Set Logging and Notification Preferences.
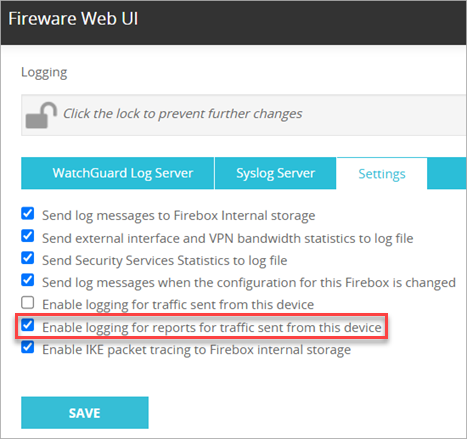
To collect the data required for this report for locally-managed Fireboxes, in Fireware Web UI or Policy Manager:
- In Policy Manager, on the Properties tab for a proxy policy, go to the Logging section and select Enable logging for reports.
- In Fireware Web UI, go to System > Logging > Settings and select the Enable logging for reports for traffic sent from this device check box.
To configure Firebox scheduled reports, go to Schedule Firebox Reports.
Quick Start — Set Up DNSWatch in WatchGuard Cloud
About DNSWatch in WatchGuard Cloud
Add a DNSWatch Configuration in WatchGuard Cloud